sbiotrellis
Plot data or simulation results in trellis plot
Syntax
Description
trellisplot = sbiotrellis(data,groupCol,xCol,yCol)data as defined by the group column
variable groupCol into its own subplot. The data defined by
column xCol is plotted against the data defined by column(s)
yCol.
trellisplot = sbiotrellis(data,fcnHandle,groupCol,xCol,yCol)data as defined by the group column
variable groupCol into its own subplot.
sbiotrellis creates the subplot by calling the function
handle, fcnHandle, with input arguments defined by the
data columns xCol and
yCol. The fcnHandle cannot be empty
and must be specified.
The fcnHandle must have the signature
fcnHandle(x,y), where x is a numeric
column vector, and y is a matrix with the same number of rows as
x.
For instance, if you want to create a trellis plot with a logarithmic
y-axis, use @semilogy as the function
handle, where semilogy is the function that plots
data with logarithmic scale for the y-axis.
trellisplot = sbiotrellis(simData,fcnHandle,xCol,yCol)simData into its own subplot.
sbiotrellis creates the subplot by calling the function
handle, fcnHandle with input arguments defined by the columns
xCol and yCol. The
fcnHandle can be empty ('' or
[]). If empty, the default time plot is created using the
handle @plot.
The fcnHandle must have the signature
fcnHandle(simDataI,xCol,yCol), where
simDataI is a single SimData object, and
xCol and yCol are the corresponding input
arguments to sbiotrellis.
Tip
Use the plot method of a sbiotrellis object to overlay
a SimData object or a dataset on an
existing sbiotrellis plot. For example,
plot(trellisplot,...) adds a plot to the object
trellisplot. The SimData or
dataset that is being plotted must have the same
number of elements or groups as the trellisplot object.
The plot method has the same input arguments as
sbiotrellis.
Examples
Load a sample dataset. The data contains measurements of drug concentration in the central and peripheral compartments for 30 subjects.
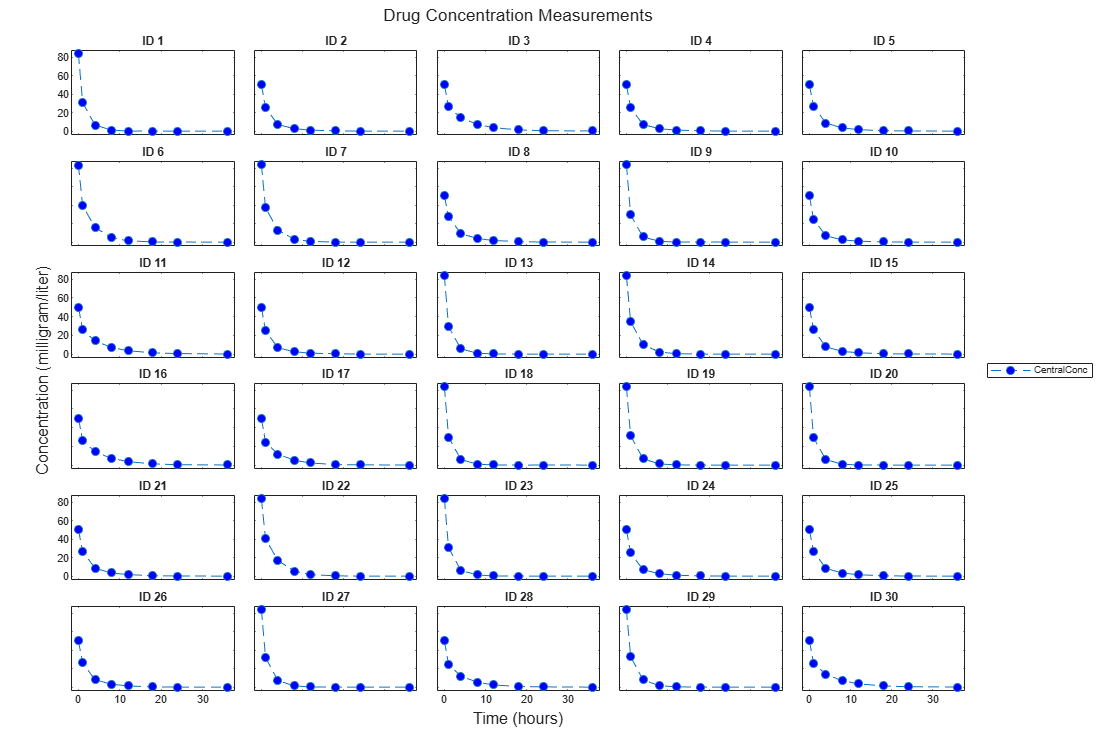
load('sd5_302RAgeSex.mat');Create a trellis plot of the Central concentrations for each subject.
t = sbiotrellis(data, 'ID', 'Time', 'CentralConc',...
               'Marker', 'o','LineStyle','--','MarkerFaceColor','b');
% Resize the figure.
t.hFig.Position(:) = [100 100 1200 800];
t.YLabel = "Concentration (milligram/liter)";
t.XLabel = "Time (hours)";
t.Title  = "Drug Concentration Measurements";
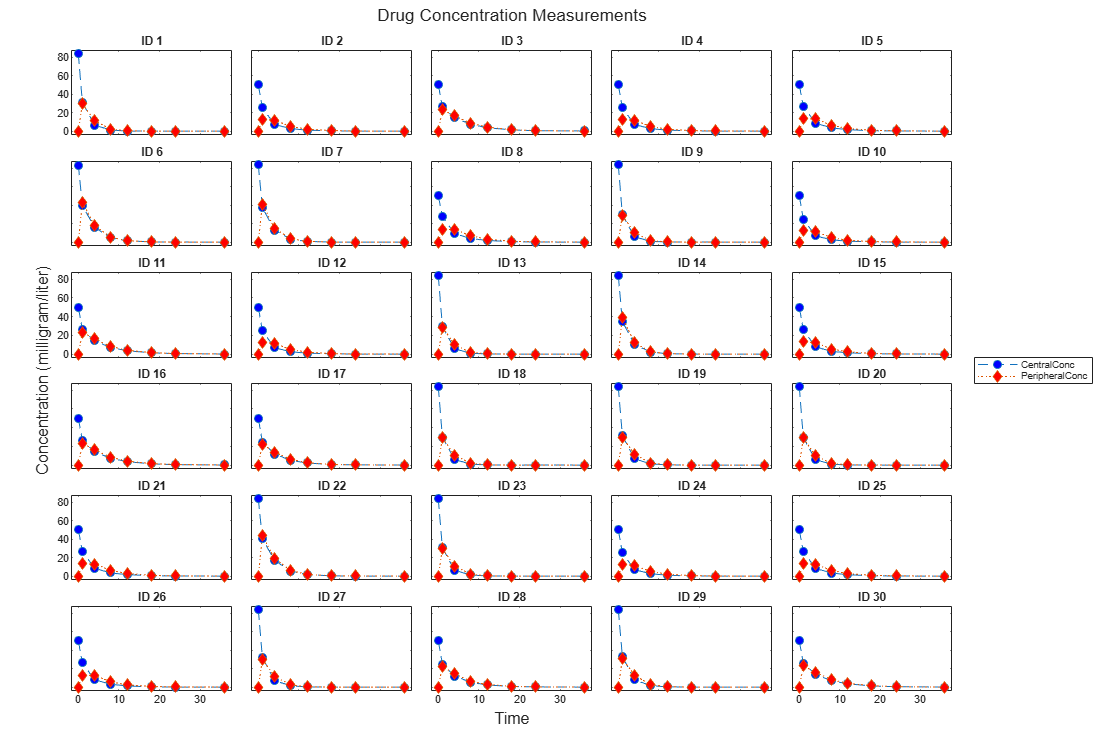
Use the plot method of the sbiotrellis object to overlay the peripheral concentration data on the same plot.
plot(t,data,'ID','Time','PeripheralConc','Marker','d',...
            'LineStyle',':','MarkerFaceColor','r');
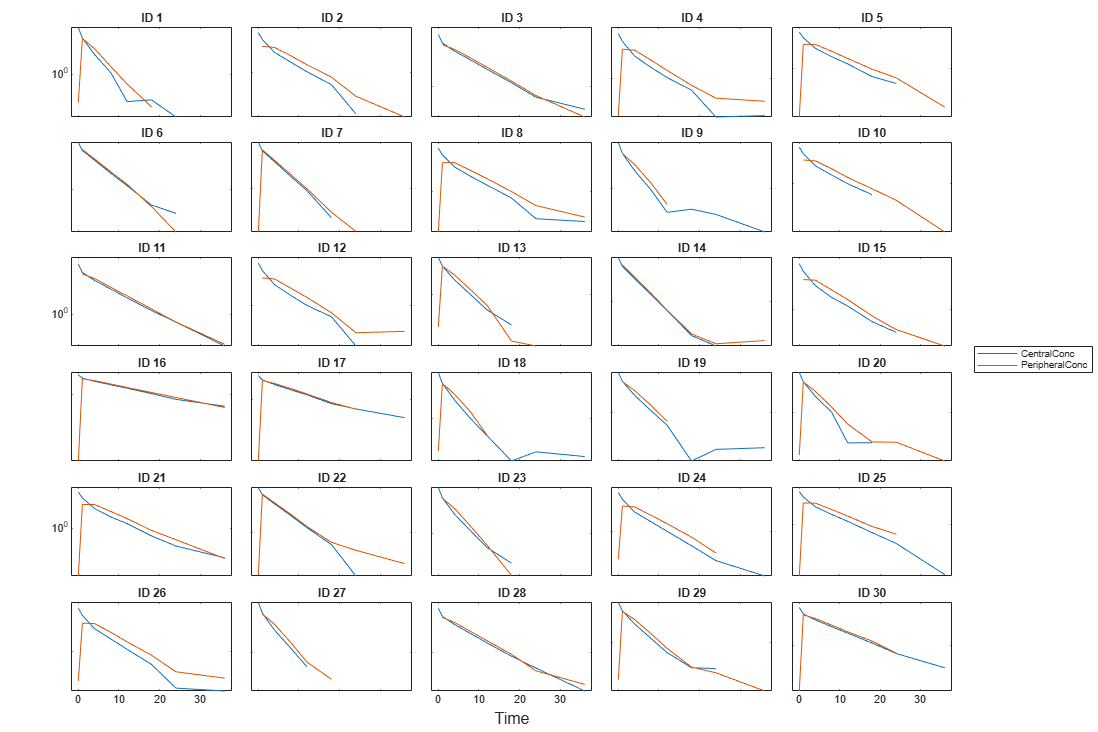
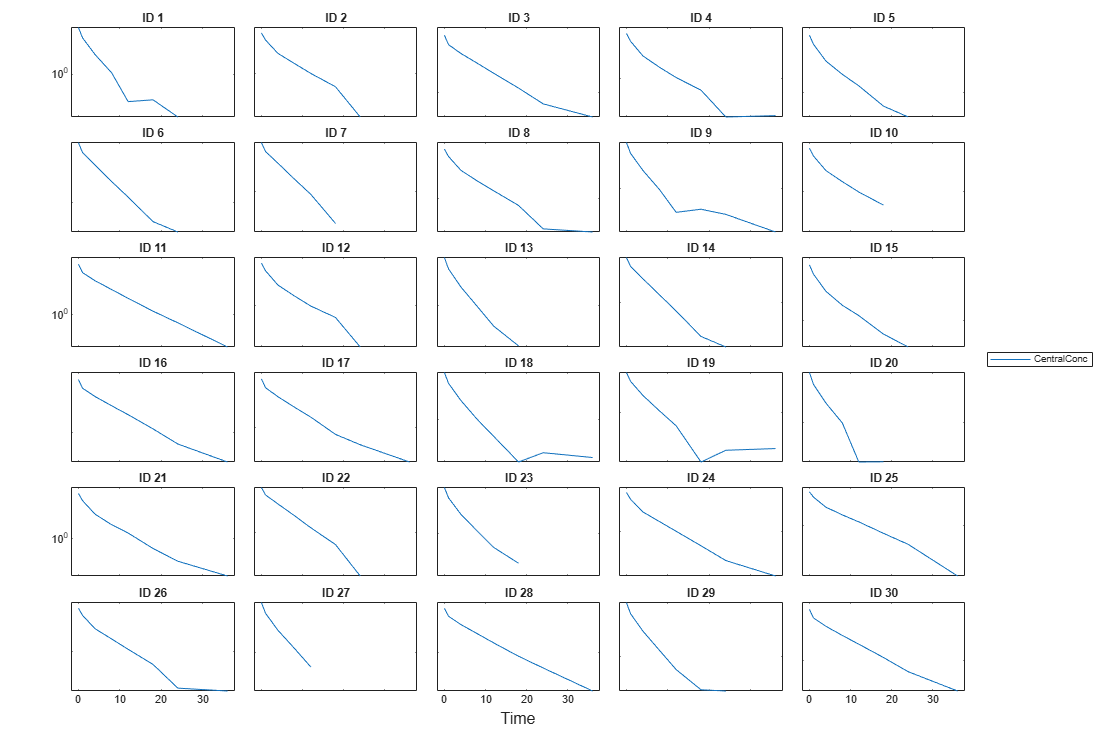
Specify the function handle @semilogy to change the y-axis to log scale.
t2 = sbiotrellis(data,@semilogy,'ID','Time','CentralConc');
%Resize the figure
t2.hFig.Position(:) = [100 100 1200 800];
plot(t2,data,@semilogy,'ID','Time','PeripheralConc');