레이블이 지정된 신호 세트 살펴보기
Label Signal Attributes, Regions of Interest, and Points 예제에서 만든 MAT 파일을 MATLAB® 작업 공간으로 불러옵니다. 신호 레이블 지정기를 사용하여 추가한 정의가 레이블이 지정된 신호 세트에 포함되어 있는지 확인합니다.
load Whale_Songs

labelDefinitionsSummary(whalesongs)ans=3×9 table
LabelName LabelType LabelDataType Categories ValidationFunction DefaultValue Sublabels Tag Description
______________ ___________ _____________ ____________ __________________ ____________ ___________________________ ___ ____________________________
"WhaleType" "attribute" "categorical" {3×1 string} {["N/A" ]} {0×0 double} {0×0 double } "" "Whale type"
"MoanRegions" "roi" "logical" {["N/A" ]} {0×0 double} {0×0 double} {0×0 double } "" "Regions where moans occur"
"TrillRegions" "roi" "logical" {["N/A" ]} {0×0 double} {0×0 double} {1×1 signalLabelDefinition} "" "Regions where trills occur"
TrillPeaks가 TrillRegions의 하위 레이블인지 확인합니다.
labelDefinitionsHierarchy(whalesongs)
ans =
    'WhaleType
       Sublabels: []
     MoanRegions
       Sublabels: []
     TrillRegions
       Sublabels: TrillPeaks
     '
세트의 두 번째 멤버를 가져옵니다. 타임테이블 변수의 이름을 가져옵니다.
song = getSignal(whalesongs,2);

summary(song)
song: 76579×1 timetable

Row Times:

    Time: duration

Variables:

    whale2: double

Statistics for applicable variables and row times:

              NumMissing        Min            Median             Max               Mean              Std

    Time          0           0 sec          9.5722 sec        19.144 sec        9.5722 sec        5.5266 sec
    whale2        0           -0.3733                 0            0.3791        8.1118e-05            0.0392
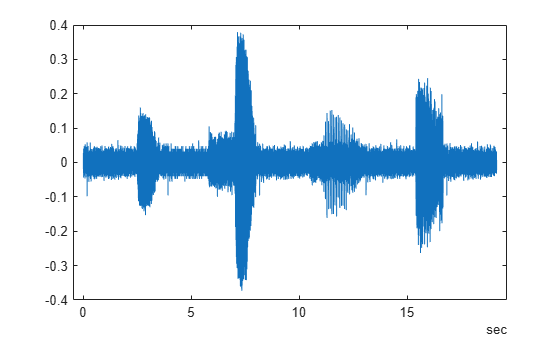
신호를 플로팅합니다.
t = song.Time;
sng = song.whale2;

plot(t,sng)
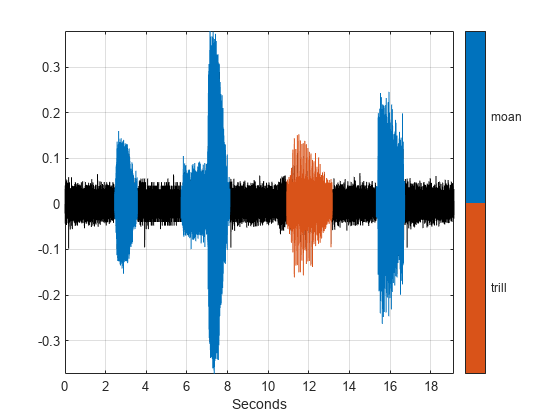
레이블이 지정된 영역 시각화하기
signalMask 객체를 사용하여 레이블을 지정한 관심 영역을 표시하고 식별합니다. 더 잘 표시하려면 레이블 값을 logical형에서 categorical형으로 변경합니다.
mvals = getLabelValues(whalesongs,2,'MoanRegions');
mvals.Value = categorical(repmat("moan",size(mvals,1),1));

tvals = getLabelValues(whalesongs,2,'TrillRegions');
tvals.Value = categorical(repmat("trill",size(tvals,1),1));

msk = signalMask([mvals;tvals],'SampleRate',1/seconds(t(2)-t(1)));

plotsigroi(msk,sng)
레이블이 지정된 지점 시각화하기
레이블을 지정한 짧게 반복되는 소리 피크를 표시하고 식별합니다.
pk = getLabelValues(whalesongs,2,{'TrillRegions','TrillPeaks'});

locs  = zeros(size(pk,1),1);
for kj = 1:length(locs)
    locs(kj) = find(seconds(t) == pk.Location(kj));
end

hold on
plot(seconds(t(locs)),sng(locs)+0.01,'v')
text(seconds(t(locs))+0.2,sng(locs)+0.05,int2str(cell2mat(pk.Value)))
hold off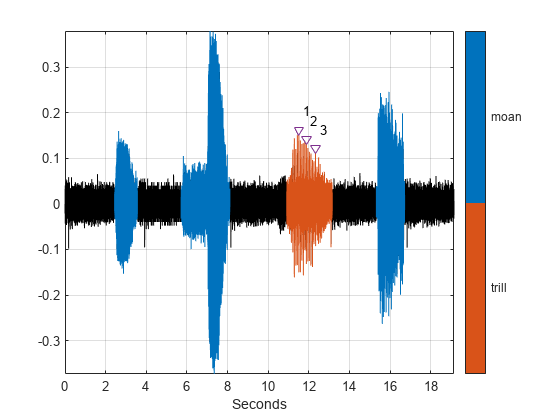
참고 항목
앱
객체
도움말 항목
- Label Signal Attributes, Regions of Interest, and Points
- ECG 신호에 레이블을 지정하고 진행 상황 추적하기
- Automate Signal Labeling with Custom Functions
- Label Spoken Words in Audio Signals
- Use Signal Labeler App
- Import Data into Signal Labeler
- Create or Import Signal Label Definitions
- Label Signals Interactively or Automatically
- Custom Labeling Functions
- Customize Labeling View
- Dashboard
- Export Data and Create Data Sets
- Signal Labeler Usage Tips