FIR 필터로 인해 발생하는 지연 보정하기
신호를 필터링하면 지연이 발생합니다. 이는 출력 신호가 입력 신호에 비해 시간적으로 이동하는 것을 의미합니다. 이 예제에서는 이러한 영향을 상쇄할 수 있는 방법을 보여줍니다.
대개 유한 임펄스 응답 필터는 모든 주파수 성분을 같은 크기만큼 지연시킵니다. 이 경우에는 시간적으로 신호를 이동시켜 쉽게 지연을 해결할 수 있습니다.
1초 동안 500Hz로 샘플링된 심전도 측정값을 가져옵니다. 랜덤 잡음을 추가합니다. 재현이 가능하도록 난수 생성기를 재설정합니다.
Fs = 500;
N = 500;
rng default

xn = ecg(N)+0.25*randn([1 N]);
tn = (0:N-1)/Fs;
75Hz가 넘는 주파수를 저지하는 필터를 사용하여 일부 잡음을 제거합니다. designfilt를 사용하여 차수가 70인 필터를 설계합니다.
nfilt = 70;
Fst = 75;

d = designfilt('lowpassfir','FilterOrder',nfilt, ...
               'CutoffFrequency',Fst,'SampleRate',Fs);
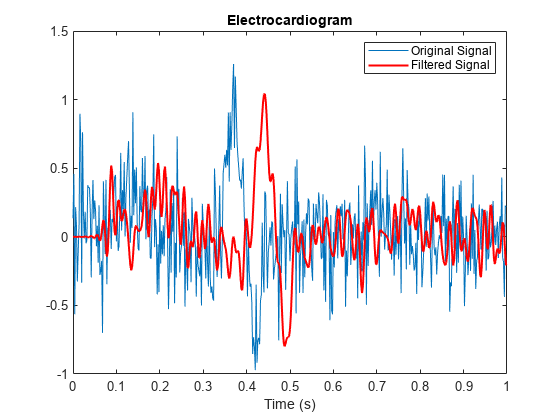
신호를 필터링한 다음 플로팅합니다. 결과로 생성된 신호는 원래 신호보다 매끄럽지만 뒤처져 있습니다.
xf = filter(d,xn);

plot(tn,xn)
hold on, plot(tn,xf,'-r','linewidth',1.5), hold off
title 'Electrocardiogram'
xlabel 'Time (s)', legend('Original Signal','Filtered Signal')

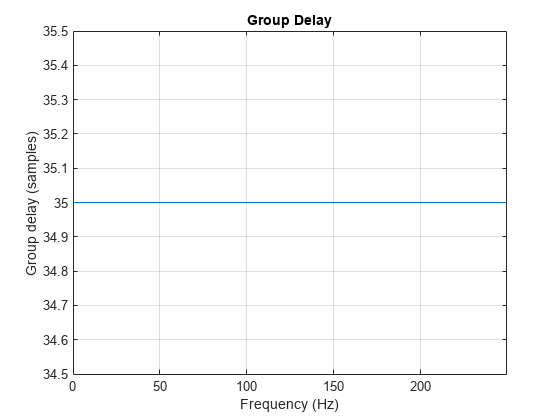
grpdelay를 사용하여, 필터로 인한 지연이 필터 차수의 절반과 같은지 확인합니다.
grpdelay(d,N,Fs)

delay = mean(grpdelay(d))
delay =
35
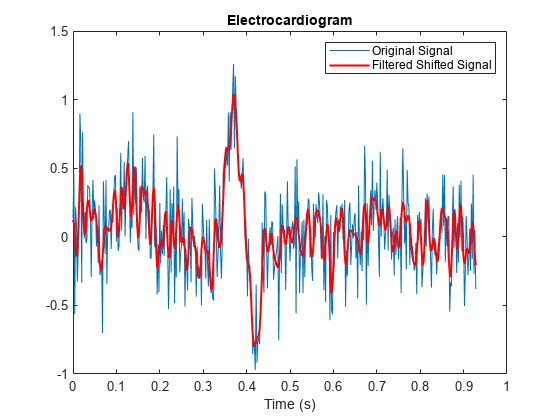
필터링된 신호를 이동하여 데이터를 정렬합니다. 처음 delay개 샘플을 제거합니다. 원래 신호와 시간 벡터의 마지막 delay개 샘플을 제거합니다.
tt = tn(1:end-delay);
sn = xn(1:end-delay);

sf = xf;
sf(1:delay) = [];
신호를 플로팅하고 신호가 정렬되었는지 확인합니다.
plot(tt,sn)
hold on, plot(tt,sf,'-r','linewidth',1.5), hold off
title 'Electrocardiogram'
xlabel('Time (s)'), legend('Original Signal','Filtered Shifted Signal')

참고 항목
designfilt | filter | filtfilt | grpdelay