신호 분석과 시각화
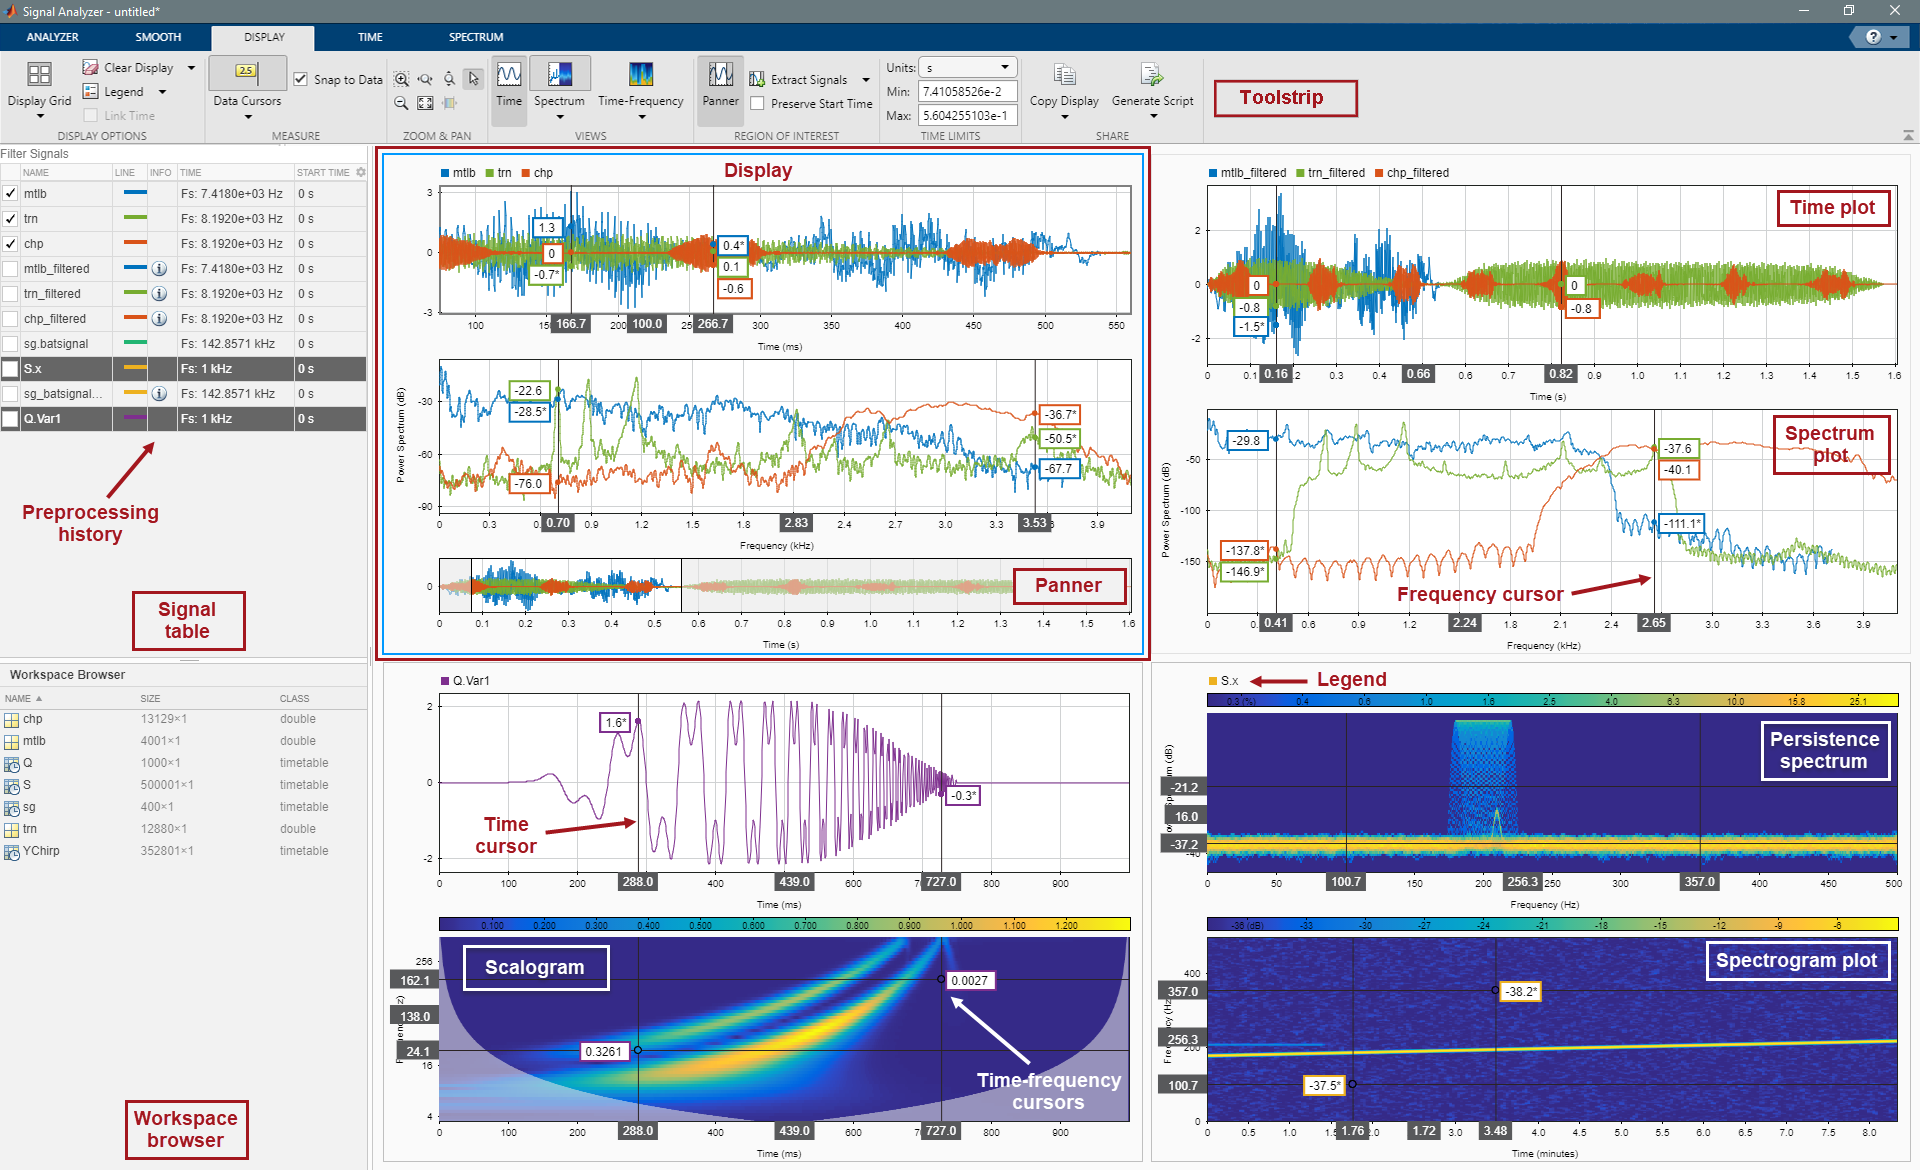
신호 분석기 앱은 시간 영역, 주파수 영역 및 시간-주파수 영역에서 신호를 시각화하고 측정하고 분석하고 비교할 수 있는 대화형 방식 툴입니다. 이 앱에서는 기간이 각기 다른 여러 신호를 하나의 뷰에서 동시에 다룰 수 있습니다.
앱을 시작하려면 MATLAB® 툴스트립의 앱 탭에서 신호 분석기 앱을 선택하면 됩니다. 또는 MATLAB 명령 프롬프트에 signalAnalyzer를 입력하여 앱을 시작할 수도 있습니다.
앱
| 신호 분석기 | 여러 개의 신호와 스펙트럼을 시각화하여 비교 |
함수
strips | 스트립 플롯 |
도움말 항목
앱 워크플로
- 신호 분석기 앱 사용하기
시간 영역, 주파수 영역 및 시간-주파수 영역에서 신호를 시각화하고 측정하고 분석하고 비교합니다.
- 단계 1: Select Signals to Analyze
- 단계 2: Preprocess Signals
- 단계 3: Explore Signals
- 단계 4: Measure Signals
- 단계 5: Share Analysis
스펙트럼 분석 및 시간-주파수 분석
- Spectrum Computation in Signal Analyzer
To compute signal spectra, Signal Analyzer finds a compromise between the best theoretical spectral resolution and the best resolution allowed by performance constraints. - Persistence Spectrum in Signal Analyzer
The persistence spectrum contains time-dependent probabilities of occurrence of signals at given frequency locations and power levels. - 신호 분석기의 스펙트로그램 계산
비정상(Nonstationary) 신호의 시간 종속 스펙트럼을 표시하기 위해 신호 분석기는 신호를 카이저 윈도우가 적용된 중첩 세그먼트로 나누고 단시간 푸리에 변환을 계산합니다. - Scalogram Computation in Signal Analyzer
The scalogram is useful for identifying signals with low-frequency components and for analyzing signals whose frequency content changes rapidly with time.
보조 항목
- Data Types Supported by Signal Analyzer
Signal Analyzer accepts vectors and matrices,timeseriesobjects, and MATLAB timetables. - Edit Sample Rate and Other Time Information
You can add and edit the time information in the Signal Analyzer app for any signal that is not a MATLAB timetable or atimeseriesobject. - Signal Analyzer Tips and Limitations
Prepare data to circumvent current limitations of Signal Analyzer. - Keyboard Shortcuts for Signal Analyzer
Use the keyboard to control the Signal Analyzer app. - Customize Signal Analyzer
Specify line color and style, add or remove columns in the Signal table, and modify Signal Analyzer displays.
추천 예제

다양한 윈도우 누설로 톤 분해하기
신호 분석기에서 정현파를 분해하기 위해 스펙트럼 누설을 조정합니다.

다양한 윈도우를 사용하여 신호 스펙트럼 계산하기
신호의 스펙트럼을 계산하고 윈도우 형태와 크기를 수정하여 분해능을 변경합니다.

Compute Envelope Spectrum of Vibration Signal
Compute the envelope spectrum of a signal and combine app-generated scripts and functions into a single workflow.

Declip Saturated Signals Using Your Own Function
Write a function to declip saturated signals and include it in Signal Analyzer.
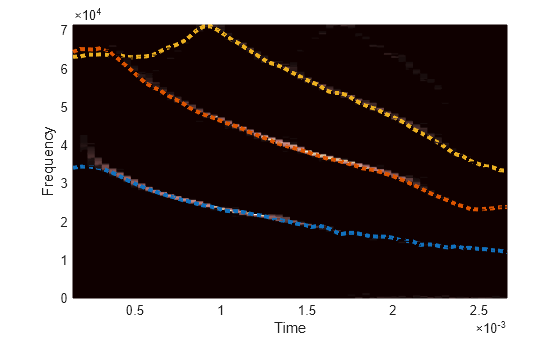
Find and Track Ridges Using Reassigned Spectrogram
Use the reassigned spectrogram in Signal Analyzer to sharpen the time and frequency localization of spectrograms.

Modulation and Demodulation Using Complex Envelope
Visualize complex-valued signals in Signal Analyzer.

Extract Voices from Music Signal
Use Signal Analyzer to extract voices from a song by duplicating and filtering signals.

흰긴수염고래 노래에서 관심 영역 추출하기
신호 분석기에서 관심 있는 신호 영역을 추출합니다.