createFeatureData
Description
[
returns a table of responses ftdata,respdata] = createFeatureData(lss,Name=Value)respdata where each variable corresponds
to the data for the specified response label. You can specify a list of label names that the
function adds as responses to respdata and other optional inputs as
name-value arguments. For example, Responses="Species" specifies
Species as a response label.
Note
The label data for all specified label names must be vertically and horizontally concatenable.
Examples
Create a set of label definitions.
Define three numeric attribute feature labels that correspond to mean frequency, band power, and peak amplitude.
Define two numeric region-of-interest (ROI) feature labels that correspond to mean and signal-to-noise ratio (SNR).
Define one categorical attribute label that has these categories:
A,B, andC.
Create a labeled signal set that contains all six label definitions.
ld1 = signalLabelDefinition("MeanFrequency", ...
    LabelType="attributeFeature",LabelDataType="numeric");
ld2 = signalLabelDefinition("BandPower", ...
    LabelType="attributeFeature",LabelDataType="numeric");
ld3 = signalLabelDefinition("PeakAmplitude", ...
    LabelType="attributeFeature",LabelDataType="numeric");

ld4 = signalLabelDefinition("Mean",LabelType="roiFeature", ...
    LabelDataType="numeric",FrameSize=500,FrameOverlapLength=250);
ld5 = signalLabelDefinition("SNR",LabelType="roiFeature", ...
    LabelDataType="numeric",FrameSize=500,FrameOverlapLength=250);

catValues = ["A" "B" "C"];
ld6 = signalLabelDefinition("Class",LabelType="attribute", ...
    LabelDataType="categorical",Categories=catValues);

lss = labeledSignalSet([],[ld1,ld2,ld3,ld4,ld5,ld6]);
Create a signalFrequencyFeatureExtractor object to extract the mean frequency, band power, and peak amplitude values across an entire signal. Create a signalTimeFeatureExtractor object to extract the mean and SNR values from signal frames that are 500 samples long and have 250 samples of overlap. Set the output format of each extractor object to a table.
H = signalFrequencyFeatureExtractor();
H.FeatureFormat = "table";
H.MeanFrequency = true;
H.BandPower = true;
H.PeakAmplitude= true;
H.setExtractorParameters("PeakAmplitude",MaxNumExtrema=5)

G = signalTimeFeatureExtractor();
G.FeatureFormat = "table";
G.FrameSize = 500;
G.FrameOverlapLength = 250;
G.Mean = true;
G.SNR = true;
Create a signal, x, made up of several sinusoids with varying frequencies. For ten iterations, add random noise to x to generate xn, and add this new signal as a member to lss. Extract the specified features from xn and set the label values in the labeled signal set equal to the values of the extracted features. Display the labels contained in the labeled signal set.
t = (1:1000)'/1e3;
x = sum(sin(2*pi*[10 100 200 350 450].*t),2);

for idx = 1:10

    xn = x + randn(size(t));
    p = extract(H,xn);

    addMembers(lss,xn);

    setLabelValue(lss,idx,"MeanFrequency",p.MeanFrequency);
    setLabelValue(lss,idx,"BandPower",p.BandPower);
    setLabelValue(lss,idx,"PeakAmplitude",p.PeakAmplitude);

    q = extract(G,xn);
    rois = q{:,[1,2]};
    setLabelValue(lss,idx,"Mean",rois,q.Mean);
    setLabelValue(lss,idx,"SNR",rois,q.SNR);

    setLabelValue(lss,idx,"Class",catValues(randi(3,[1 1])));
end

LBLS = lss.Labels
LBLS=10×6 table
                  MeanFrequency    BandPower                    PeakAmplitude                      Mean            SNR        Class
                  _____________    __________    ___________________________________________    ___________    ___________    _____

    Member{1}      {[1.4789]}      {[3.4261]}    {[ 9.0290 11.1191 11.4532 12.0216 13.2064]}    {3×2 table}    {3×2 table}      C
    Member{2}      {[1.4040]}      {[3.4643]}    {[ 11.3509 9.5855 12.0983 11.9682 12.5628]}    {3×2 table}    {3×2 table}      C
    Member{3}      {[1.4642]}      {[3.5901]}    {[10.9591 10.3477 14.7581 11.1874 12.6932]}    {3×2 table}    {3×2 table}      A
    Member{4}      {[1.3684]}      {[3.5572]}    {[ 12.9701 11.7092 13.0650 9.5547 12.5720]}    {3×2 table}    {3×2 table}      B
    Member{5}      {[1.4672]}      {[3.4403]}    {[ 10.7361 9.3758 13.8124 10.7749 13.3737]}    {3×2 table}    {3×2 table}      A
    Member{6}      {[1.4241]}      {[3.5225]}    {[10.3302 11.5979 11.6696 11.2745 12.2777]}    {3×2 table}    {3×2 table}      C
    Member{7}      {[1.4070]}      {[3.3863]}    {[ 10.5294 11.4855 12.5187 9.8425 12.6257]}    {3×2 table}    {3×2 table}      A
    Member{8}      {[1.4529]}      {[3.4818]}    {[ 9.8225 10.6672 13.3820 10.7357 12.6096]}    {3×2 table}    {3×2 table}      B
    Member{9}      {[1.4181]}      {[3.5552]}    {[12.4350 11.5933 12.0069 11.1148 12.9654]}    {3×2 table}    {3×2 table}      B
    Member{10}     {[1.4198]}      {[3.5516]}    {[11.3011 10.5433 13.6415 11.5888 13.1569]}    {3×2 table}    {3×2 table}      C
Create a table that contains feature data corresponding to all feature labels in lss. The Class data is not included in the table because Class is not a feature label.
FTs = createFeatureData(lss,ConvertFeaturesToRows=true)
FTs=10×5 table
    MeanFrequency    BandPower                    PeakAmplitude                                     Mean                                  SNR
    _____________    _________    ______________________________________________    _____________________________________    _____________________________

       1.4789         3.4261       9.029    11.119    11.453    12.022    13.206    -0.021921      -0.04995     -0.043343    -4.7744    -6.8315    -5.7233
        1.404         3.4643      11.351    9.5855    12.098    11.968    12.563     0.058634      0.037199      0.014408    -6.6994    -4.8069     -6.049
       1.4642         3.5901      10.959    10.348    14.758    11.187    12.693     0.023716      0.022439      0.052243    -4.4364    -5.5243    -5.9047
       1.3684         3.5572       12.97    11.709    13.065    9.5547    12.572      0.04709       0.04225     0.0099387    -5.2615    -5.9997    -4.9845
       1.4672         3.4403      10.736    9.3758    13.812    10.775    13.374     0.014723      0.023537      0.044529    -4.5713    -5.9291    -5.9603
       1.4241         3.5225       10.33    11.598     11.67    11.274    12.278    -0.032001     -0.050336     -0.081017    -5.1732    -5.8918    -6.9184
        1.407         3.3863      10.529    11.486    12.519    9.8425    12.626     0.016776      0.029752     -0.016017    -6.5449    -3.5879     -5.754
       1.4529         3.4818      9.8225    10.667    13.382    10.736     12.61    -0.003218     0.0095321      0.017105    -5.8408    -6.5075    -6.0452
       1.4181         3.5552      12.435    11.593    12.007    11.115    12.965    -0.092008     -0.055926     -0.037221    -6.9075    -6.6543    -5.6822
       1.4198         3.5516      11.301    10.543    13.641    11.589    13.157     0.066601      0.011827    -0.0096364    -6.3197    -5.7298    -7.0011
Create another table containing feature data that corresponds only to attribute feature labels. Use the getLabelNames function to specify label names corresponding to attribute features. Specify Class as a response label to obtain a second output table that contains the category each member belongs to.
[attFTs,R] = createFeatureData(lss, ...
             Features=getLabelNames(lss,LabelType="attributeFeature"), ...
             ConvertFeaturesToRows=true,Responses="Class")
attFTs=10×3 table
    MeanFrequency    BandPower                    PeakAmplitude
    _____________    _________    ______________________________________________

       1.4789         3.4261       9.029    11.119    11.453    12.022    13.206
        1.404         3.4643      11.351    9.5855    12.098    11.968    12.563
       1.4642         3.5901      10.959    10.348    14.758    11.187    12.693
       1.3684         3.5572       12.97    11.709    13.065    9.5547    12.572
       1.4672         3.4403      10.736    9.3758    13.812    10.775    13.374
       1.4241         3.5225       10.33    11.598     11.67    11.274    12.278
        1.407         3.3863      10.529    11.486    12.519    9.8425    12.626
       1.4529         3.4818      9.8225    10.667    13.382    10.736     12.61
       1.4181         3.5552      12.435    11.593    12.007    11.115    12.965
       1.4198         3.5516      11.301    10.543    13.641    11.589    13.157
R=10×1 table
    Class
    _____

      C
      C
      A
      B
      A
      C
      A
      B
      B
      C
You can use the getLabelIndices function to specify indices for labels you want to include in the feature table. Create a table containing feature data that corresponds only to ROI feature labels. Use the ExpandResponseLabels argument to repeat response labels for each member.
[roiFTs,R] = createFeatureData(lss, ...
             Features=getLabelIndices(lss,LabelType="roiFeature"), ...
             Responses="Class",ExpandResponseLabels=true)
roiFTs=30×2 table
      Mean         SNR
    _________    _______

    -0.021921    -4.7744
     -0.04995    -6.8315
    -0.043343    -5.7233
     0.058634    -6.6994
     0.037199    -4.8069
     0.014408     -6.049
     0.023716    -4.4364
     0.022439    -5.5243
     0.052243    -5.9047
      0.04709    -5.2615
      0.04225    -5.9997
    0.0099387    -4.9845
     0.014723    -4.5713
     0.023537    -5.9291
     0.044529    -5.9603
    -0.032001    -5.1732
      ⋮
R=30×1 table
    Class
    _____

      C
      C
      C
      C
      C
      C
      A
      A
      A
      B
      B
      B
      A
      A
      A
      C
      ⋮
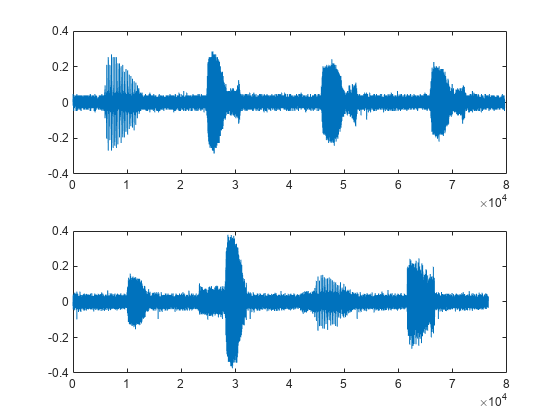
Load a labeled signal set containing recordings of whale songs.
load whales
lss
lss =
labeledSignalSet with properties:
Source: {2×1 cell}
NumMembers: 2
TimeInformation: "sampleRate"
SampleRate: 4000
Labels: [2×3 table]
Description: "Characterize wave song regions"
Use labelDefinitionsHierarchy to see a list of labels and sublabels.
Use setLabelValue to add data to the set.
Retrieve and plot the signals contained in lss. Each whale song consists of four sounds.
for k = 1:lss.NumMembers
    [s,info] = getSignal(lss,k);
    fs = lss.SampleRate;
    t = 0:length(s)-1/fs;
    subplot(2,1,k)
    plot(t,s)
end
Add numeric region-of-interest (ROI) feature label definitions to lss that you will use to specify the shape factor and peak values of each signal. Specify a frame size equal to 25% of the signal length, so that each region corresponds to a different sound.
Create a signalTimeFeatureExtractor object to extract the shape factor and peak value of each ROI. Set the roiFeature label values in the labeled signal set to the values of the extracted features.
sld1 = signalLabelDefinition("ShapeROI",LabelType="roiFeature", ...
      LabelDataType="numeric",FrameSize=round(0.25*length(s))-1);

sld2 = signalLabelDefinition("PeakROI",LabelType="roiFeature", ...
      LabelDataType="numeric",FrameSize=round(0.25*length(s))-1);

addLabelDefinitions(lss,[sld1 sld2]);

sFE = signalTimeFeatureExtractor(SampleRate=fs, ...
    FrameSize=round(0.25*length(s))-1);
sFE.FeatureFormat = "table";
sFE.ShapeFactor = true;
sFE.PeakValue = true;

for i = 1:lss.NumMembers
    sig = getSignal(lss,i);
    fts = extract(sFE,sig);

    setLabelValue(lss,i,"ShapeROI", ...
        [fts.FrameStartTime fts.FrameEndTime],fts.ShapeFactor);
    setLabelValue(lss,i,"PeakROI", ...
        [fts.FrameStartTime fts.FrameEndTime],fts.PeakValue);
end
Use the getLabelDefinitions function to obtain the label names corresponding to roiFeature labels in lss. Create a matrix of data that corresponds to the ROI feature labels in the labeled signal set, where each column is a feature.
lbldefs = getLabelDefinitions(lss,LabelType="roiFeature");
lbldefs(:).Name
ans = "ShapeROI"
ans =
"PeakROI"
ftdata = createFeatureData(lss, ...
    Features=[lbldefs(1).Name lbldefs(2).Name],OutputFormat="matrix")
ftdata = 8×2

    1.6908    0.2694
    1.7483    0.2850
    1.6517    0.2421
    1.5930    0.2264
    1.4750    0.1599
    1.8366    0.3791
    1.3921    0.1612
    1.6176    0.2633
Input Arguments
Name-Value Arguments
Output Arguments
Version History
Introduced in R2022a