geometryFromEdges
분해된 지오메트리 행렬에서 2차원 지오메트리 생성
설명
예제
사각형을 나타내는 분해된 솔리드 지오메트리 모델을 만들고 이를 PDE 모델에 포함시킵니다.
디폴트 스칼라 PDE 모델을 만듭니다.
model = createpde;
사각형을 나타내는 지오메트리를 정의합니다.
R1 = [3,4,-1,1,1,-1,0.5,0.5,-0.75,-0.75]';
지오메트리를 최소 영역으로 분해합니다.
g = decsg(R1);
분해된 지오메트리 행렬에서 지오메트리를 만듭니다.
geometryFromEdges(model,g);
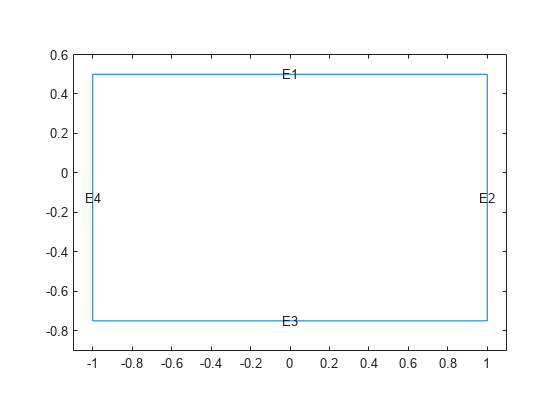
지오메트리를 플로팅합니다.
pdegplot(model,EdgeLabels="on")
axis equal
xlim([-1.1,1.1])
ylim([-0.9,0.6])
분해된 솔리드 지오메트리 모델을 생성하여 이를 PDE 모델에 포함시킵니다.
디폴트 스칼라 PDE 모델을 만듭니다.
model = createpde;
사각형 안에 원을 정의하고, 이들을 하나의 행렬에 넣고, 사각형에서 원을 빼는 집합 공식을 만듭니다.
R1 = [3,4,-1,1,1,-1,0.5,0.5,-0.75,-0.75]';
C1 = [1,0.5,-0.25,0.25]';
C1 = [C1;zeros(length(R1) - length(C1),1)];
gm = [R1,C1];
sf = 'R1-C1';
지오메트리를 만듭니다.
ns = char('R1','C1');
ns = ns';
g = decsg(gm,sf,ns);
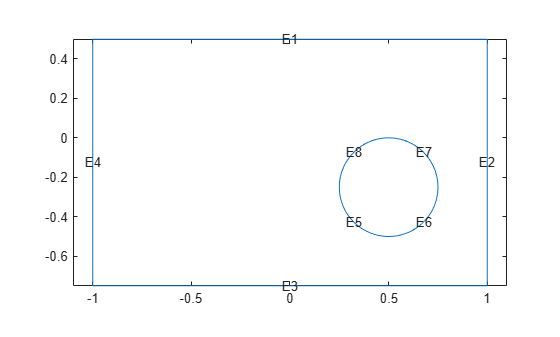
지오메트리를 모델에 포함시키고 이를 플로팅합니다.
geometryFromEdges(model,g);
pdegplot(model,EdgeLabels="on")
axis equal
xlim([-1.1,1.1])
툴박스는 여러 지오메트리 함수를 제공합니다. 다음 함수 핸들을 사용하여 이를 지정합니다.
model = createpde;
g = geometryFromEdges(model,@cardg);
pdegplot(model)

clear model
model = createpde;
g = geometryFromEdges(model,@circleg);
pdegplot(model)
clear model
model = createpde;
g = geometryFromEdges(model,@cirsg);
pdegplot(model)
clear model
model = createpde;
g = geometryFromEdges(model,@crackg);
pdegplot(model)
clear model
model = createpde;
g = geometryFromEdges(model,@lshapeg);
pdegplot(model)
clear model
model = createpde;
g = geometryFromEdges(model,@scatterg);
pdegplot(model)
clear model
model = createpde;
g = geometryFromEdges(model,@squareg);
pdegplot(model)