Main Content

navGraph

Create navGraph object

Since R2023a

    Description

    The navGraph object is a graph data structure for Navigation Toolbox™ that aids search-based planners.

    The navGraph object enables you to create a graph and perform computations on it. The navGraph object supports functionalities that are frequently used by graph search algorithms. You can easily implement Dijkstra, A*, or variants using navGraph.

    In graph theory, states represent nodes and links represent edges. The states and links are represented by their corresponding row index in the table. The navGraph is a directed graph that currently supports unique names, with no self-loops in edges.

    Creation

    Description

    graph = navGraph(states,links) creates a navGraph object with nodes specified as a matrix of states and edges specified as a matrix of links (or end nodes). The states and links inputs set the values of the States and Links properties, respectively.

    graph = navGraph(___,Name=Value) specifies additional parameters using the Name and Weight name-value arguments in addition to the argument from the previous syntax.

    graph = navGraph(digraph) creates a navGraph object from the data present in the specified digraph object.

    graph = navGraph(stateTable,linkTable) creates a navGraph object with the specified state table and link table, which contain the metadata for the graph. The stateTable and linkTable inputs set the value of the States and Links properties, respectively.

    example

    graph = navGraph(___,Name=Value) specifies additional parameters using the LinkWeightFcn name-value argument in addition to the arguments from the previous syntaxes.

    Input Arguments

    expand all

    State vectors, specified as a matrix in which each row represents a state vector.

    Example: [9 10 0.42; 10 10 0.92; 7 10 0.65]

    Data Types: double

    Link vectors, specified as a matrix in which each row represents a pair of state IDs as a two-element row vector of positive integers.

    Example: [6 1; 7 7; 6 6]

    Data Types: double

    Directed graph, specified as a digraph object. The first column must be StateVector in the digraph object node table.

    State table of graph nodes, specified as a table with rows containing variables describing the nodes (states) of the graph. The first column must be StateVector, which represents the state vectors of the environment. You can optionally include other metadata columns, such as a Name column representing the names of the states.

    Example: table([9 10 0.42; 10 10 0.92; 7 10 0.65],VariableNames={'StateVector'})

    Data Types: table

    Link table of graph edges, specified as a table with rows containing variables describing edges (links) of the graph. The first column must be EndStates, which represents the connecting states. You can optionally include other metadata columns, such as a Weight column representing the costs of traversing the links.

    Example: table([6 1; 7 7; 6 6],VariableNames={'EndStates'})

    Data Types: table

    Name-Value Arguments

    Specify optional pairs of arguments as Name1=Value1,...,NameN=ValueN, where Name is the argument name and Value is the corresponding value. Name-value arguments must appear after other arguments, but the order of the pairs does not matter.

    Example: LinkWeightFcn=@nav.algs.distanceManhattan

    State names, specified as a column vector of characters, column vector of strings, or cell array of characters. The number of rows must be equal to the number of states, and the value of each row must be unique.

    Example: Name=["A"; "B"; "C"]

    Example: Name={'A'; 'B'; 'C'}

    Data Types: string | cell

    Link weights, specified as a numeric column vector. The number of rows must be equal to the number of links. If you specify link weights, the function computes transition costs with those weights and ignores the values specified by LinkWeightsFcn argument.

    Example: Weight=[2.22; 24.41; 42.76]

    Data Types: single | double

    Link weights function, specified as a function handle that computes the link weights in the absence of the Weight argument. The LinkWeightFcn argument sets the value of the LinkWeightFcn property.

    The function handle must be one of these types:

    1. COST = @(STATE1,STATE2)fcn, where STATE1 and STATE2 are state vectors.

    2. COST = @(STATEID1,STATEID2,GRAPHOBJ)fcn, where STATEID1 and STATEID2 are state indices.

    STATE1 and STATEID1 can have a single row or N rows, while STATE2 and STATEID2 must have N rows.

    Note

    For best performance, vectorize the function handle.

    Example: LinkWeightFcn=@nav.algs.distanceManhattan

    Data Types: function_handle

    Properties

    expand all

    This property is read-only.

    State table of graph nodes, specified as a table with rows containing variables describing the nodes (states) of the graph. The first column must be StateVector, which represents the state vectors of the environment. You can optionally include other metadata columns, such as a Name column representing the names of the states.

    Data Types: table

    This property is read-only.

    Link table of graph edges, specified as a table with rows containing variables describing edges (links) of the graph. The first column must be EndStates, which represents the connecting states. You can optionally include other metadata columns, such as a Weight column representing the costs of traversing the links.

    Data Types: table

    Link weight function, specified as a function handle that computes the cost of traversing the link.

    The function handle must be one of these types:

    1. COST = @(STATE1,STATE2)fcn, where STATE1 and STATE2 are state vectors.

    2. COST = @(STATEID1,STATEID2,GRAPHOBJ)fcn, where STATEID1 and STATEID2 are state indices.

    STATE1 and STATEID1 can have a single row or N rows, while STATE2 and STATEID2 must have N rows.

    Note

    For best performance, vectorize the function handle.

    Example: graph.LinkWeightFcn=@nav.algs.distanceManhattan

    Data Types: function_handle

    Object Functions

    addstateAdd one or more states to graph
    addlinkAdd links between one or more state pairs
    rmstateRemove one or more states from graph
    rmlinkRemove links between one or more state pairs
    findlinkFind IDs of links
    findstateFind IDs of states
    index2stateFind state vectors of state indices
    state2indexFind indices for queried state vectors
    successorsFind successive state indices and costs
    showPlot graph representation
    copyCreate deep copy of navGraph object

    Examples

    collapse all

    Load data for states and links.

    load navGraphData.mat

    Create state and link tables.

    stateTable = table(data.states,data.names,data.numLanes, ...
        VariableNames=["StateVector","Name","Lanes"]);
    linkTable = table(data.links,data.linkWt,data.curvature, ...
        VariableNames=["EndStates","Weight","Curvature"]);

    Create a navGraph object from the state and link tables.

    graphObj = navGraph(stateTable,linkTable);

    Create a deep copy of the navGraph object.

    graph2 = copy(graphObj)
    graph2 = 
      navGraph with properties:
    
               States: [8x3 table]
                Links: [7x3 table]
        LinkWeightFcn: @nav.algs.distanceEuclidean


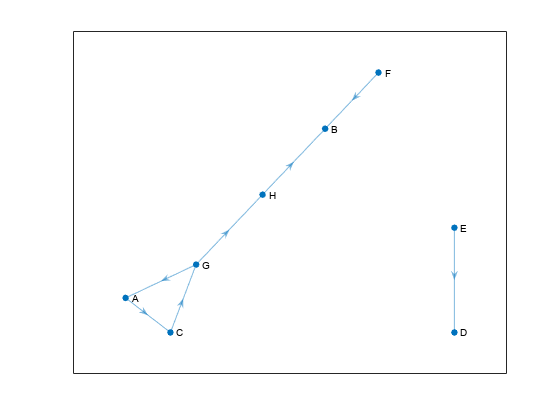
    Visualize the navGraph object.

    show(graphObj)

    Figure contains an axes object. The axes object contains an object of type graphplot.

    Find the link IDs of two state pairs. The function returns the link ID for the state pair ["G","A"]. However, it returns 0 as the link ID for the state pair ["C","D"] as the link does not exist in the navGraph object.

    linkIDS = findlink(navGraphObj,["G","A"; "C","D"])
    linkIDS = 2×1
    
         5
         0


    Extended Capabilities

    Version History

    Introduced in R2023a

    Go to top of page