plotSection
Visualize explicit MPC control law as 2-D sectional plot
Description
plotSection(
displays a 2-D sectional plot of the piecewise affine regions used by an explicit
MPC controller. All but two of the control law’s free parameters are fixed, as
specified by empcobj,plotParams)plotParams. The two remaining variables form the
plot axes. By default, the empcobj.Range property sets the bounds
for these axes.
Examples
Define a double integrator plant model and create a traditional implicit MPC controller for this plant. Constrain the manipulated variable to have an absolute value less than 1.
plant = tf(1,[1 0 0]);
mpcobj = mpc(plant,0.1,10,3);
-->"Weights.ManipulatedVariables" is empty. Assuming default 0.00000.
-->"Weights.ManipulatedVariablesRate" is empty. Assuming default 0.10000.
-->"Weights.OutputVariables" is empty. Assuming default 1.00000.
mpcobj.MV = struct('Min',-1,'Max',1);
Define the parameter bounds for generating an explicit MPC controller.
range = generateExplicitRange(mpcobj);
-->Converting the "Model.Plant" property to state-space.
-->Converting model to discrete time.
   Assuming no disturbance added to measured output #1.
-->"Model.Noise" is empty. Assuming white noise on each measured output.
range.State.Min(:) = [-4;-4];
range.State.Max(:) = [ 4; 4];
range.Reference.Min(:) = -2;
range.Reference.Max(:) = 2;
range.ManipulatedVariable.Min(:) = -1.1;
range.ManipulatedVariable.Max(:) = 1.1;
Create an explicit MPC controller.
empcobj = generateExplicitMPC(mpcobj,range);
Regions found / unexplored: 19/ 0
Create a default plot parameter structure, which specifies that all of the controller parameters are fixed at their nominal values for plotting.
plotParams = generatePlotParameters(empcobj);
Allow the controller states to vary when creating a plot.
plotParams.State.Index = [];
plotParams.State.Value = [];
Fix the manipulated variable and reference signal to 0 for plotting.
plotParams.ManipulatedVariable.Index(1) = 1;
plotParams.ManipulatedVariable.Value(1) = 0;
plotParams.Reference.Index(1) = 1;
plotParams.Reference.Value(1) = 0;
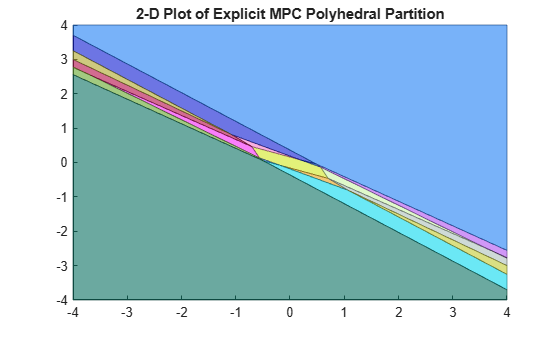
Generate the 2-D section plot for the explicit MPC controller.
plotSection(empcobj,plotParams)
ans =
  Figure (1: PiecewiseAffineSectionPlot) with properties:

      Number: 1
        Name: 'PiecewiseAffineSectionPlot'
       Color: [1 1 1]
    Position: [161 234 560 337.1114]
       Units: 'pixels'

  Show all properties
Input Arguments
Version History
Introduced in R2014b
See Also
Functions
generatePlotParameters|generateExplicitMPC|generateExplicitRange|generateExplicitOptions|simplify|mpcmoveExplicit|sim
Objects
mpc|explicitMPC|mpcstate