Label 3-D Medical Image Using Medical Image Labeler
This example shows how to label 3-D image data using the Medical Image Labeler app. The Medical Image Labeler app provides manual, semi-automated, and automated tools for labeling 3-D medical image data. This example segments a chest CT volume to label a lung tumor region.
Download Data to Label
This example labels chest CT data from a subset of the Medical Segmentation Decathlon data set [1]. The size of the subset of data is approximately 76 MB. Run this code to download the MedicalVolumNIfTIData.zip file from the MathWorks® website, then unzip the file.
zipFile = matlab.internal.examples.downloadSupportFile("medical","MedicalVolumeNIfTIData.zip");
filepath = fileparts(zipFile);
unzip(zipFile,filepath)
The dataFolder folder contains the downloaded and unzipped data.
dataFolder = fullfile(filepath,"MedicalVolumeNIfTIData");Open the Medical Image Labeler
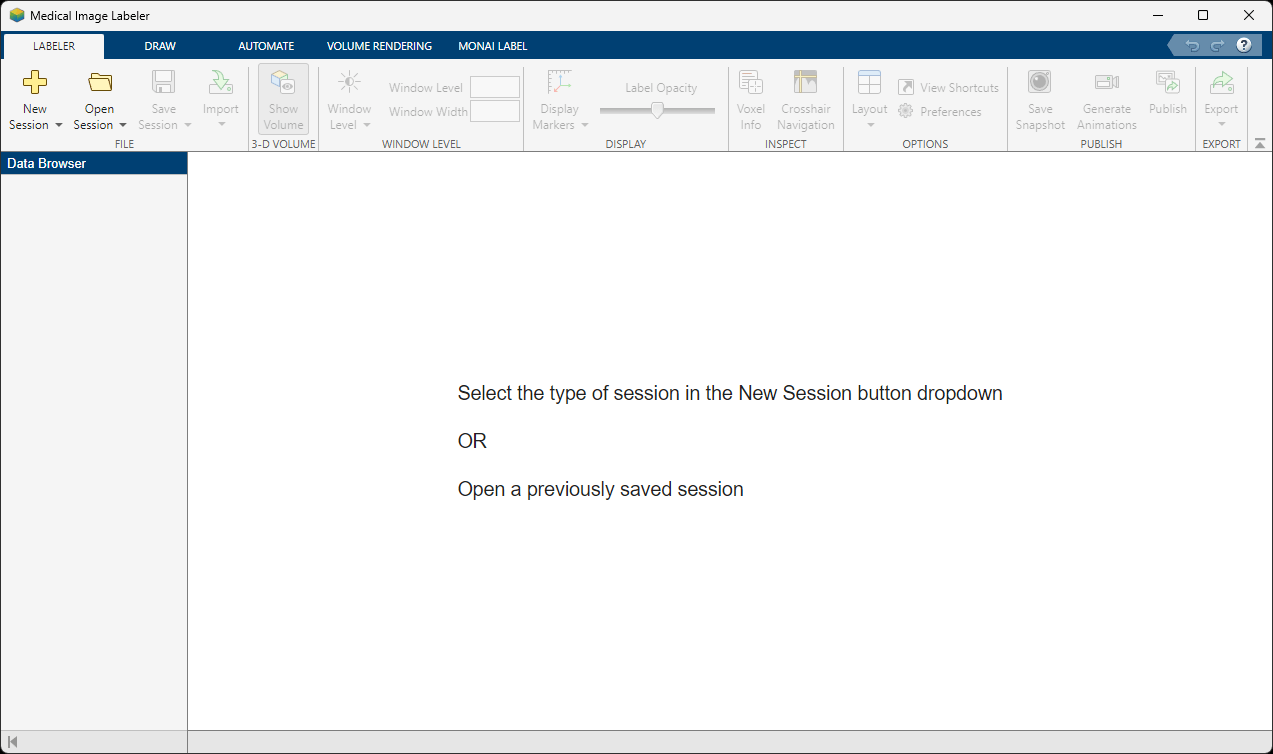
Open the Medical Image Labeler app from the Apps tab on the MATLAB® toolstrip, under Image Processing and Computer Vision. You can also load the app by using the medicalImageLabeler command.
Create New Volume Labeling Session
To start a new 3-D labeling session, on the app toolstrip, click New Session and select New Volume Session (3-D). In the Create a new session folder dialog box, specify a location in which to save the new session folder by entering a path or selecting Browse and navigating to your desired location. In the New Session Folder dialog box, specify a name for the folder for this labeling session. Then, select Create Session.
Load Image Data into Medical Image Labeler
To load an image into the Medical Image Labeler app, on the app toolstrip, click Import Data. Then, under Data, select From File. Browse to the location where you downloaded the data. You can find the data location by checking the dataFolder value in the workspace. Once you browse to the download location, press Shift and select the files lung_027.nii.gz and lung_043.nii.gz. Click Open to import the files. For a Volume Session, the imported data file can be a single DICOM, NIfTI, NRRD, or TIFF file containing a 3-D image volume, or a directory containing multiple DICOM files corresponding to a single image volume. You can also import a medicalVolume object from the workspace.
The name of the imported image is visible in the Data Browser pane. You can import multiple 3-D image files into a Volume Session. All files imported into a single app session must label the same regions of interest, such as tumor or lung, and are exported together as one groundTruthMedical object.

Explore the Image Volume
The Medical Image Labeler app displays a 3-D rendering of the scan in the 3-D Volume pane, and displays anatomical slice planes in the Transverse, Sagittal, and Coronal panes. You can toggle the visibility of the volume display using the Show Volume button on the Labeler tab of the app toolstrip.
By default, the app displays the center slice in each slice plane. You can change which slice is displayed by using the scroll bar at the bottom of a slice pane, or you can click the pane and then press the left and right arrow keys. The app displays the current slice number out of the total number of slices, such as 132/264, for each slice pane. The app also displays anatomical display markers indicating the anterior (A), posterior (P), left (L), right (R), superior (S), and inferior (I) directions. You can zoom in on the current slice pane using the mouse scroll wheel or the zoom controls that appear when you pause on the slice pane.
You can also navigate between slices in the three planes using crosshair navigation. To turn on the crosshair indicators, in the Labeler tab of the app toolstrip, select Crosshair Navigation. The indicators show the relative positions of the slices in the other 2-D views. To navigate slices, pause on one of the crosshair axes until the cursor changes to the fleur shape, ![]() , and then click and drag to a new position. The other slice views update automatically. To hide the crosshairs, in the app toolstrip, clear Crosshair Navigation.
, and then click and drag to a new position. The other slice views update automatically. To hide the crosshairs, in the app toolstrip, clear Crosshair Navigation.

By default, the app displays the scan using the Radiological display convention, with the left side of the patient on the right side of the image. To display the left side of the patient on the left side of the image, on the app toolstrip, click Preferences, and in the dialog box that opens, change the Display Convention to Neurological.
To change the brightness or contrast of the display, adjust the display window. Changing the display window does not modify the underlying image data. To update the display window, you can directly edit the values in the Window Level and Window Width boxes in the app toolstrip.
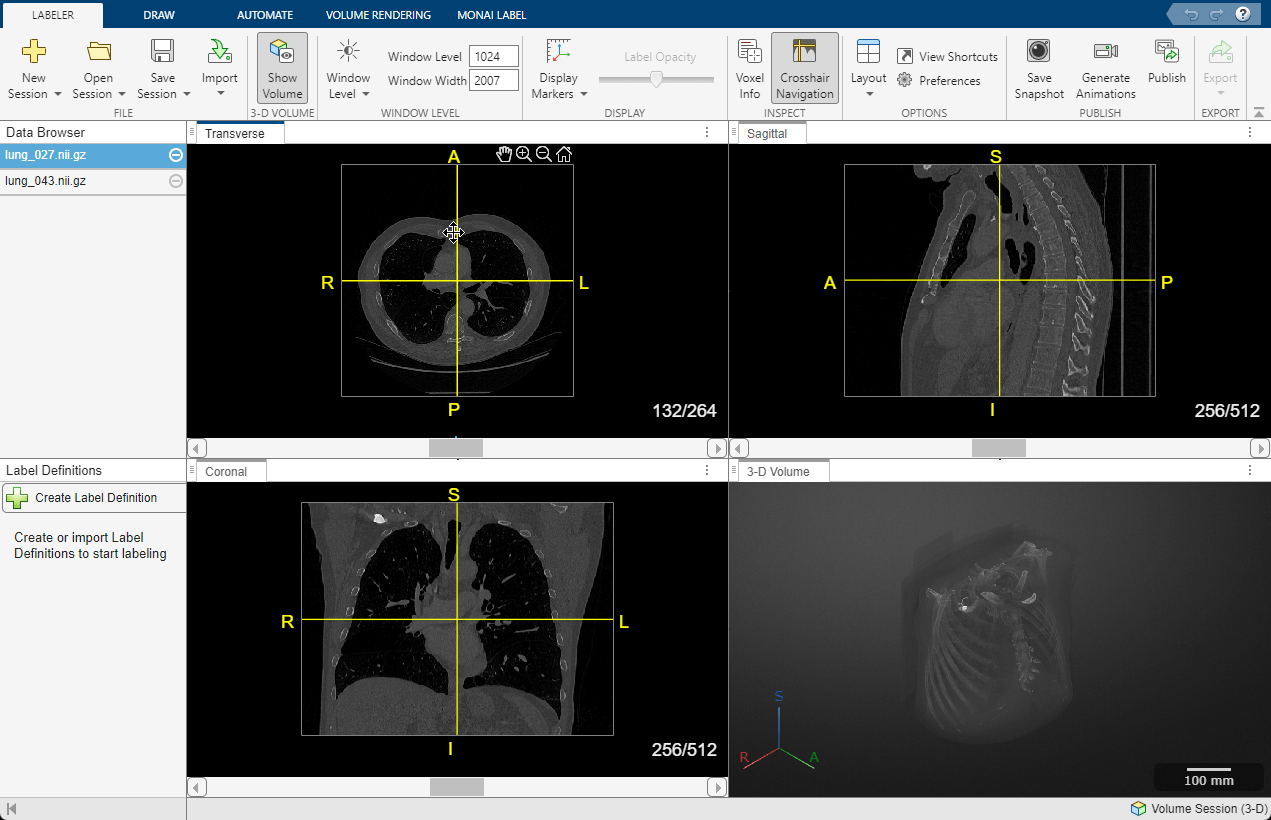
Alternatively, adjust the window using the Window Level tool. First, select ![]() in the app toolstrip. Then, click and hold in any of the slice panes, and drag up and down to increase and decrease the brightness, respectively, or left and right to increase and decrease the contrast. The Window Level and Window Width values in the toolstrip automatically update as you drag. Clear
in the app toolstrip. Then, click and hold in any of the slice panes, and drag up and down to increase and decrease the brightness, respectively, or left and right to increase and decrease the contrast. The Window Level and Window Width values in the toolstrip automatically update as you drag. Clear ![]() to deactivate the tool. To reset the brightness and contrast, click Window Level and select Reset. You can swap the mouse actions, such that dragging vertically changes the contrast and dragging horizontally changes the brightness, in the Preferences dialog box.
to deactivate the tool. To reset the brightness and contrast, click Window Level and select Reset. You can swap the mouse actions, such that dragging vertically changes the contrast and dragging horizontally changes the brightness, in the Preferences dialog box.
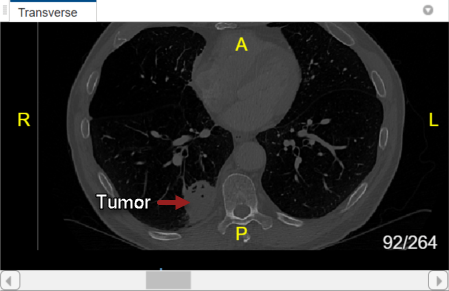
With lung_027.nii.gz selected in the Data Browser pane, explore the chest volume to identify the tumor region you want to label. The tumor is visible between slices 79 and 105 in the Transverse slice pane.

Create Label Definitions
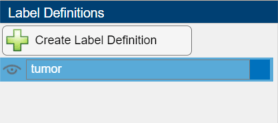
A label definition specifies the name, color, and numeric index of a label. In the Label Definitions pane, select Create Label Definition to create a label with the default name Label1. To change the name of the label, double-click on the label and type in a new name. The label name must be a valid MATLAB® variable name with no spaces. For this example, specify the name of the label as tumor. To change the default color associated with the label, double-click on the colored square in the label identifier and select a color from the Color dialog box.
Use Drawing Tools to Label Regions in Image
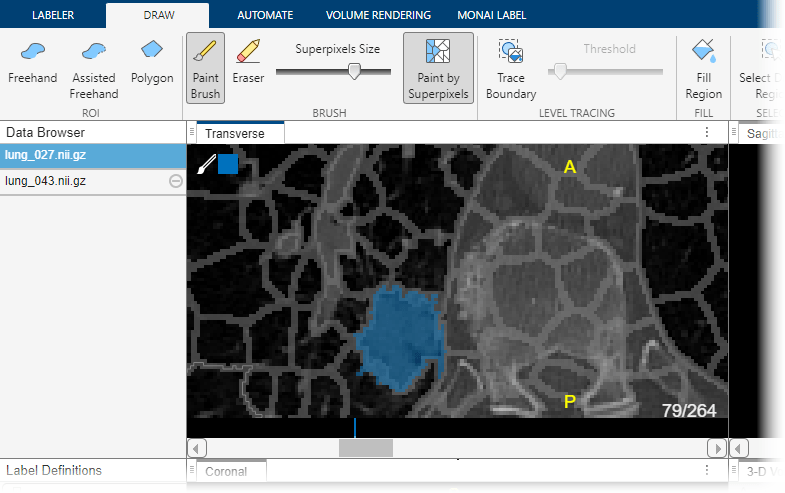
Click on the tumor label in the Label Definitions pane to assign pixels to the tumor label. You can use the tools on the Draw tab in the app toolstrip to define the region. To learn more about each of the available drawing tools, see Get Started with Medical Image Labeler. This example uses the Paint Brush tool, with Paint by Superpixels enabled, to label the tumor. You can draw labels in the Transverse, Sagittal, or Coronal slice panes. For this example, label slice 79 in the Transverse pane. When you add the label, the app adds a bar above the slider, using the color associated with the label, to indicate which slices you have labeled.
In addition to the drawing tools, you can add or refine label regions using the tools in the Automate tab of the app toolstrip. The app provides slice-based automation algorithms including Active Contours, Adaptive Threshold, Dilate, and Erode, as well as volume-based algorithms including Filter and Threshold, Smooth Edges, and Otsu's Threshold. To apply a slice-based algorithm, click Algorithm Parameters to adjust settings if applicable, select an option from the Slice Direction list, and click Run. You can also specify a custom range of slices to process by specifying a Start slice and an End slice.
Use Interpolation to Speed Up Labeling
You can move through the image volume and draw labels slice-by-slice. The Medical Image Labeler app also provides interpolation tools in the Draw tab that can help with labeling an object between slices.
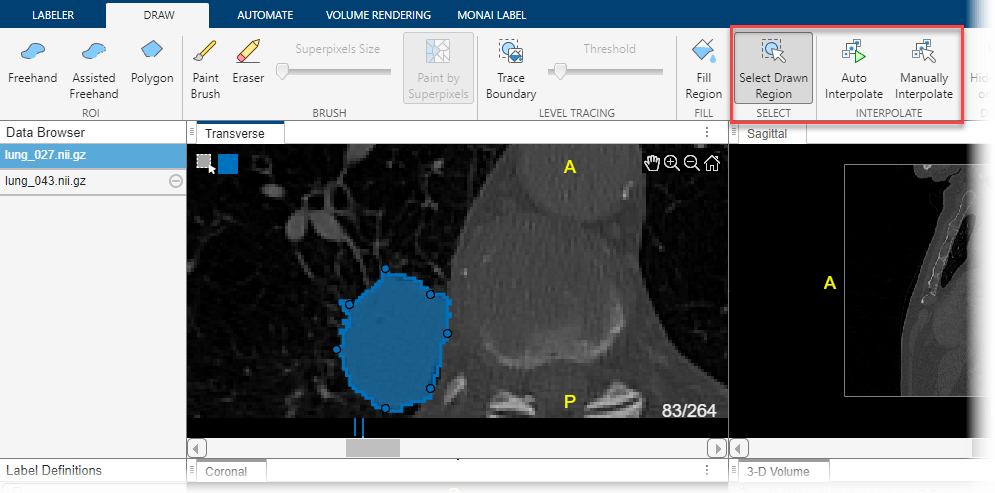
To use interpolation, you must first manually label a region on two slices. You have already labeled the tumor in slice 79. Use the same process to label the tumor in slice 83. If the Auto Interpolate button is not active, make sure the labeled region is selected by clicking Select Drawn Region in the app toolstrip and selecting the labeled region.
Click Auto Interpolate. The app automatically labels the tumor in the intermediate slices. The app adds bars above the slider to indicate all the slices that have labeled pixels, which now appears as a solid bar from slice 79 to slice 83.
Alternatively, after labeling an ROI on two slices, you can click Manually Interpolate. With this option, the app opens the Manually Interpolate dialog box. Select the two regions between which you want to interpolate, Region One and Region Two. To select the first region, use the slider at the bottom of the dialog box to navigate to slice 79, and then click inside the labeled tumor. To select the second region, click Region Two, navigate to slice 83, and click inside the labeled tumor. After selecting both regions, click Run to interpolate the label in the intermediate slices.
After using interpolation, check the individual slices to see if the interpolation created satisfactory labels. You can manually correct labels using the Paint Brush and Eraser tools. Alternatively, you can refine the labels using one of the tools in the Automate tab. For example, you can use Active Contours to grow an ROI in a slice where it does not fill the full area of the tumor. You can also undo the interpolation and try interpolating across fewer slices to improve results.
Visualize and Modify Labels
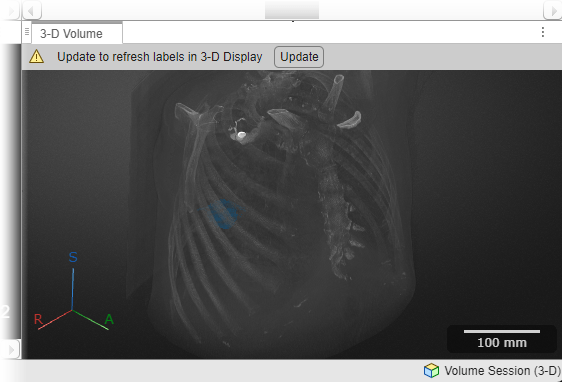
As you draw labels, you can view them as an overlay in the 3-D Volume pane. In the warning message at the top of the 3-D Volume pane, click Update. Note that Update is only available after you update the label data in a slice pane. To adjust the opacity of all labels in the session, in the Labeler tab of the app toolstrip, adjust the Label Opacity slider. To toggle the visibility of an individual label, in the Label Definitions pane, click the eye symbol ![]() next to the label name.
next to the label name.

To refine drawn labels, you can remove label data from individual pixels, from individual slices within an image, from an entire image, or from the whole labeling session.
Remove labels from individual pixels — In the Draw tab, use the Eraser tool.
Remove labels from one connected region in a slice — Click Select Drawn Region and, in the slice pane, select the region from which you want to remove labels. You can also select the label to remove by right-clicking on the label within the slice plane and selecting Select Drawn Region. Press Delete, or right-click and select Delete, to remove labels from the region.
Remove all labels from a slice — Right-click anywhere on the slice and select Select All. Press Delete, or right-click and select Delete, to remove all labels from the slice.
Remove all labels from an image volume — Right-click the file name of the image volume in the Data Browser and select Remove Labels. Removing labels from an image volume removes all pixel labels for all label definitions within the file.
Remove a label from all images within the app session — In the Label Definitions pane, right-click the label name and select Delete. This deletes the label from the
groundTruthMedicalobject in the session folder, and removes all pixel labels for the deleted label name in all images in the session.
Apply Custom Automation Algorithm
Optionally, you can add a custom automation algorithm to use in the app. See Automate Labeling in Medical Image Labeler for an example that applies a custom automation algorithm for 2-D labeling.
To add an algorithm, on the Automate tab, click Add Algorithm. You can specify a Slice-Based or a Volume-Based algorithm, where slice-based algorithms operate slice-by-slice along one direction, and volume-based algorithms operate on the volume in 3-D. Import an existing algorithm by selecting From File, or create a new algorithm by selecting New > Function Template. The template opens in the MATLAB editor. Replace the sample code in the template with code that you want to use. Your function must accept two arguments: each slice as a separate image, and a mask. Your function must also return a mask image. When you are done editing the template, save the file. The Medical Image Labeler app automatically creates a button in the Automate tab toolstrip for your function.
To test a volume-based function, select your algorithm and click Run. The algorithm processes the volume. The slices panes update to show the new labels.
To test a slice-based algorithm, select your algorithm, choose the Slice Direction to apply the algorithm in, and click Run. By default, the app applies the function to only the current slice. After testing your function on a single slice, you can run it on all of the slices, or a subset of the slices, in the selected direction. You can run it from the current slice to the end (the highest numbered slice) or from the current slice back to the beginning (slice 1). You can also specify a range of slices by specifying the starting slice and the ending slice.
Label Next Image Volume
For this example, the labels for lung_027.nii.gz are complete when you have labeled each slice of the tumor. Medical Image Labeler automatically assigns a value of 0 to unlabeled pixels in the label images saved to the session folder, so you do not need to label the background manually.
To move to the next volume, select lung_043.nii.gz in the Data Browser pane. Repeat the labeling process to draw labels on the tumor region in this volume.

Export Ground Truth Data
The Medical Image Labeler app automatically saves a groundTruthMedical object as a MAT file in the session folder. You can also export a groundTruthMedical object, saved as a MAT file, to an alternate file location from the app. On the Labeler tab, click Export and, under Ground Truth, select To File.
You can load the exported MAT file into the MATLAB workspace using the load function. The properties of the groundTruthMedical object, gTruthMed, contain information about the image data source, label definitions, and location of the saved label images. Display information about the object and each of its properties using these commands.
gTruthMed— Display the properties of thegroundTruthMedicalobject.gTruthMed.DataSource— Location of the source of the unlabeled medical volumes.gTruthMed.LabelDefinitions— Table of information about label definitions.gTruthMed.LabelData— Locations of the saved, labeled images.
References
[1] Medical Segmentation Decathlon. "Lung." Tasks. Accessed May 10, 2018. http://medicaldecathlon.com/.
The Lung data set is provided by the Medical Segmentation Decathlon under the CC-BY-SA 4.0 license. All warranties and representations are disclaimed. See the license for details. This example uses a subset of the original data set consisting of two CT volumes. The labels shown in this example were created for illustration purposes and have not been verified by a clinician.
See Also
Medical Image
Labeler | groundTruthMedical