tiledlayout
서브플롯을 표시하기 위한 타일 형식 차트 레이아웃 만들기
구문
설명
tiledlayout은 현재 Figure에 서브플롯이라고도 하는 여러 플롯을 표시하기 위한 타일 형식 차트 레이아웃을 만듭니다. 레이아웃은 Figure의 크기와 좌표축 개수에 따라 임의 개수의 플롯을 표시하고 재배치할 수 있습니다. Figure가 없는 경우 MATLAB®은 Figure를 만들어 레이아웃을 배치합니다. 현재 Figure에 기존 레이아웃 또는 좌표축이 포함된 경우 MATLAB은 해당 레이아웃을 새 레이아웃으로 바꿉니다. (R2024b 이후)
타일 형식 차트 레이아웃에는 전체 Figure 또는 부모 컨테이너를 포함하는 보이지 않는 타일 그리드가 포함됩니다. 각 타일은 플롯을 표시할 axes 객체를 포함할 수 있습니다. 레이아웃을 생성한 후에는 nexttile 함수를 호출하여 axes 객체를 레이아웃에 배치합니다. 그런 다음, 플로팅 함수를 호출하여 좌표축에 플로팅합니다.
tiledlayout(는 여러 좌표축을 포함할 수 있는 레이아웃을 만듭니다. 처음에는 전체 레이아웃을 채우는 빈 타일 하나만 있습니다. 다음과 같이 arrangement 값을 지정하여 후속 좌표축의 배치를 제어합니다.arrangement)
"flow"— Figure의 크기와 좌표축 개수에 따라 재배치 가능한 좌표축의 그리드를 위한 레이아웃을 만듭니다."vertical"— 좌표축을 세로로 쌓을 수 있는 레이아웃을 만듭니다. (R2023a 이후)"horizontal"— 좌표축을 가로로 쌓을 수 있는 레이아웃을 만듭니다. (R2023a 이후)
arrangement 인수를 괄호 없이 지정할 수 있습니다. 예를 들어, tiledlayout vertical은 좌표축을 세로로 쌓을 수 있는 레이아웃을 만듭니다.
tiledlayout(___,는 하나 이상의 이름-값 쌍 인수를 사용하여 레이아웃에 대한 추가 옵션을 지정합니다. 다른 모든 입력 인수 다음에 옵션을 지정합니다. 예를 들어, Name,Value)tiledlayout(2,2,"TileSpacing","compact")는 타일 간 간격이 최소인 2×2 레이아웃을 만듭니다. 속성 목록은 TiledChartLayout 속성를 참조하십시오.
t = tiledlayout(___)은 TiledChartLayout 객체를 반환합니다. 레이아웃을 만든 후 t를 사용하여 속성을 구성합니다.
예제
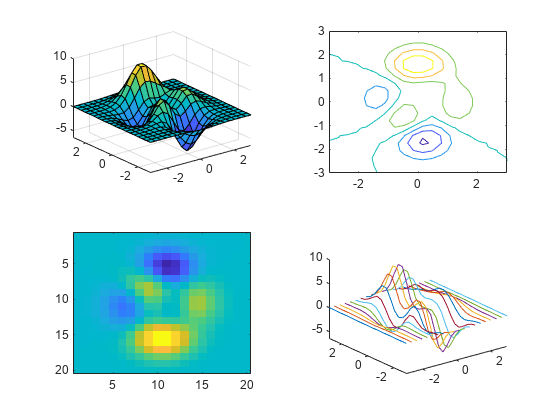
2×2 타일 형식 차트 레이아웃을 만들고 peaks 함수를 호출하여 미리 정의된 곡면의 좌표를 가져옵니다. nexttile 함수를 호출하여 첫 번째 타일에 axes 객체를 만듭니다. 그런 다음, surf 함수를 호출하여 좌표축에 플로팅합니다. 다른 세 타일에 대해 다른 플로팅 함수를 사용하여 과정을 반복합니다.
tiledlayout(2,2);
[X,Y,Z] = peaks(20);

% Tile 1
nexttile
surf(X,Y,Z)

% Tile 2
nexttile
contour(X,Y,Z)

% Tile 3
nexttile
imagesc(Z)

% Tile 4
nexttile
plot3(X,Y,Z)
R2024b 이후
4개의 좌표 벡터 x, y1, y2, y3을 만듭니다.
x = linspace(0,30);
y1 = sin(x/2);
y2 = sin(x/3);
y3 = sin(x/4);
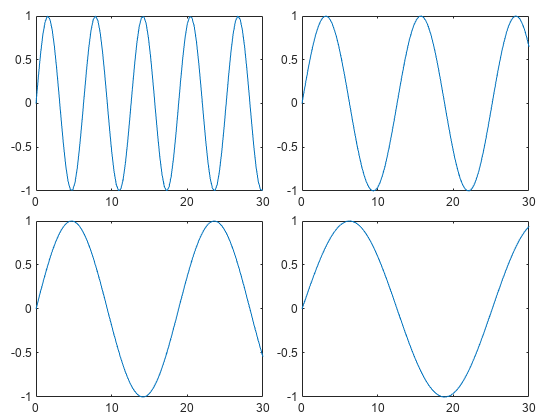
어떤 플롯 개수도 수용할 수 있는 타일 형식 차트 레이아웃을 만들려면 입력 인수 없이 tiledlayout 함수를 호출하십시오. (tiledlayout("flow") 명령을 사용해도 같은 결과를 얻을 수 있습니다.)
nexttile 함수를 호출하여 첫 번째 좌표축을 만듭니다. 그런 다음 좌표축의 x에 대해 y1을 플로팅하고 제목을 추가합니다. 이 플롯은 전체 레이아웃을 채웁니다.
tiledlayout
nexttile
plot(x,y1)
title("Plot of sin(x/2)")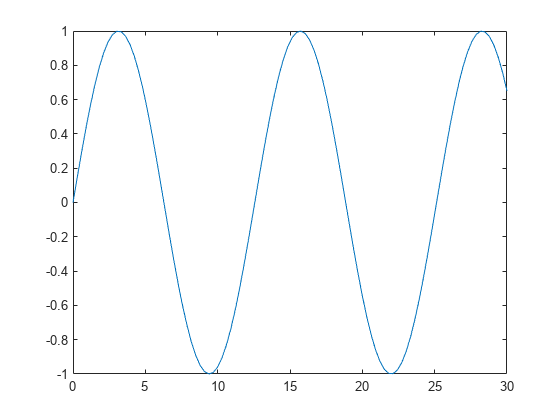
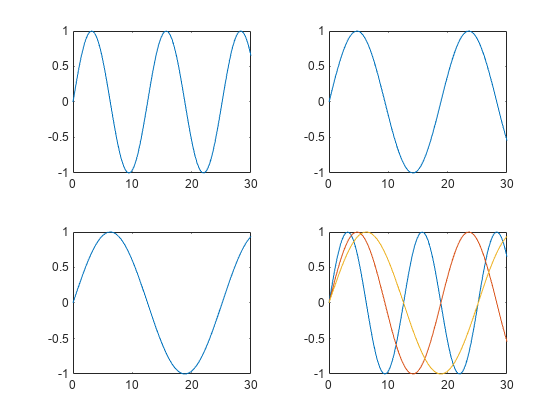
두 번째 타일과 좌표축을 만들고 해당 좌표축으로 플로팅합니다.
nexttile
plot(x,y2)
title("Plot of sin(x/3)")
과정을 반복하여 세 번째 플롯을 만듭니다.
nexttile
plot(x,y3)
title("Plot of sin(x/4)")
과정을 반복하여 네 번째 플롯을 만듭니다. 이번에는 y1을 플로팅한 후 hold on을 호출하여 동일한 축에 세 개의 선을 모두 플로팅합니다.
nexttile
plot(x,y1)
hold on
plot(x,y2)
plot(x,y3)
title("Three Sine Waves")
hold off
tiledlayout 함수를 호출할 때 "vertical" 옵션을 지정하여 플롯을 세로로 쌓는 타일 형식 차트 레이아웃을 만듭니다. 그런 다음 nexttile 함수를 호출한 후 플로팅 함수를 호출하여 세 개의 플롯을 만듭니다. nexttile을 호출할 때마다 새로운 axes 객체가 쌓임 순서의 맨 아래에 추가됩니다.
tiledlayout("vertical")
x = 0:0.1:5;
nexttile
plot(x,sin(x))
nexttile
plot(x,sin(x+1))
nexttile
plot(x,sin(x+2))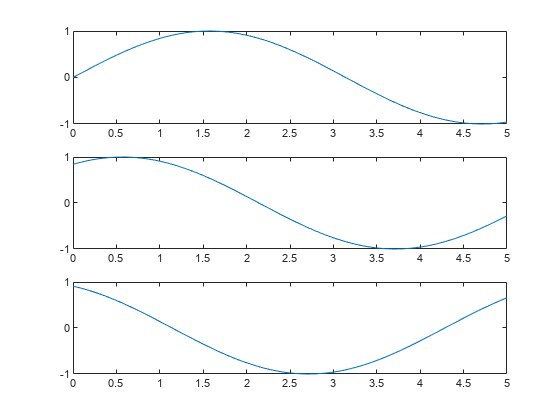
tiledlayout 함수를 호출할 때 "horizontal" 옵션을 지정하여 플롯을 가로로 쌓는 타일 형식 차트 레이아웃을 만듭니다. 그런 다음 nexttile 함수를 호출한 후 플로팅 함수를 호출하여 세 개의 플롯을 만듭니다. nexttile을 호출할 때마다 새로운 axes 객체가 쌓임 순서의 오른쪽에 추가됩니다.
tiledlayout("horizontal")
x = 0:0.1:10;
nexttile
plot(x,sin(x/2))
nexttile
plot(x,sin(x))
nexttile
plot(x,sin(2*x))
5개의 좌표 벡터 x, y1, y2, y3, y4를 만듭니다. 그런 다음 tiledlayout 함수를 호출하여 2×2 레이아웃을 만들고 TileChartLayout 객체를 저장할 반환 인수를 지정합니다. plot 함수를 호출하기 전에 nexttile 함수를 호출하여 다음 빈 타일에 axes 객체를 만듭니다.
x = linspace(0,30);
y1 = sin(x);
y2 = sin(x/2);
y3 = sin(x/3);
y4 = sin(x/4);
t = tiledlayout(2,2);

% Tile 1
nexttile
plot(x,y1)

% Tile 2
nexttile
plot(x,y2)

% Tile 3
nexttile
plot(x,y3)

% Tile 4
nexttile
plot(x,y4)

TileSpacing 속성을 'compact'로 설정하여 타일 사이의 간격을 줄입니다. 그런 다음 Padding 속성을 'compact'로 설정하여 레이아웃의 가장자리와 Figure의 가장자리 사이의 간격을 줄입니다.
t.TileSpacing = 'compact';
t.Padding = 'compact';
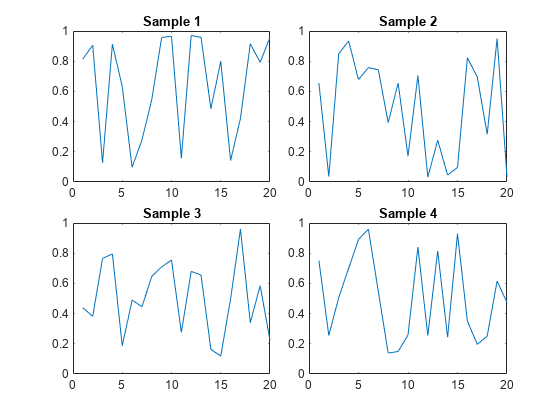
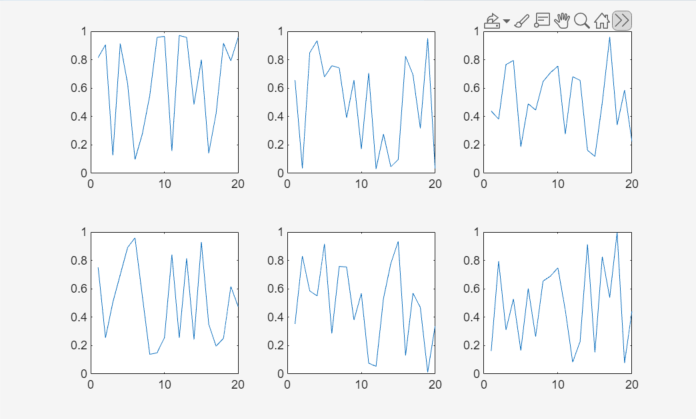
2×2 타일 형식 차트 레이아웃 t를 만듭니다. TileSpacing 이름-값 쌍의 인수를 지정하여 타일 사이의 공간을 최소합니다. 그런 다음 각 타일에 제목이 지정된 플롯을 만듭니다.
t = tiledlayout(2,2,'TileSpacing','Compact');

% Tile 1
nexttile
plot(rand(1,20))
title('Sample 1')

% Tile 2
nexttile
plot(rand(1,20))
title('Sample 2')

% Tile 3
nexttile
plot(rand(1,20))
title('Sample 3')

% Tile 4
nexttile
plot(rand(1,20))
title('Sample 4')
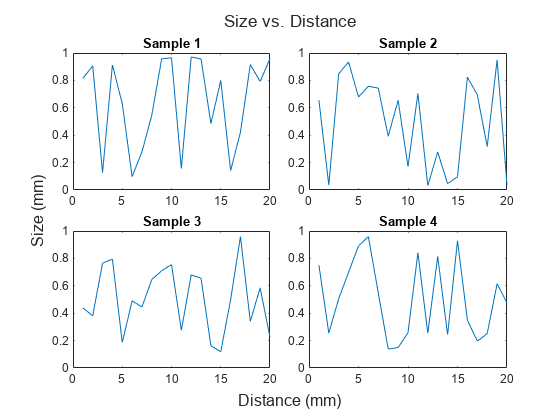
t를 title, xlabel, ylabel 함수에 전달하여 공유된 제목과 축 레이블을 표시합니다.
title(t,'Size vs. Distance')
xlabel(t,'Distance (mm)')
ylabel(t,'Size (mm)')
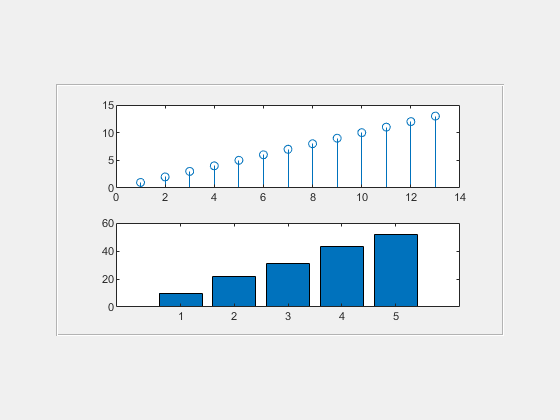
Figure에 패널을 만듭니다. 그런 다음 panel 객체를 tiledlayout 함수의 첫 번째 인수로 지정하여 패널에 타일 형식 차트 레이아웃을 만듭니다. 각 타일에 플롯을 표시합니다.
p = uipanel('Position',[.1 .2 .8 .6]);
t = tiledlayout(p,2,1);

% Tile 1
nexttile(t)
stem(1:13)

% Tile 2
nexttile(t)
bar([10 22 31 43 52])
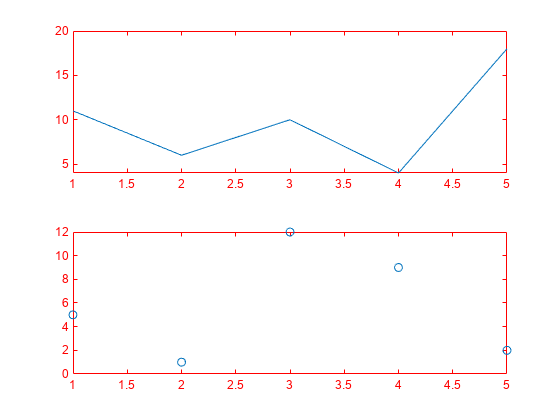
tiledlayout 함수를 호출하여 2×1 타일 형식 차트 레이아웃을 만듭니다. 좌표축을 저장할 출력 인수를 사용하여 nexttile 함수를 호출합니다. 그런 다음 좌표축에 플로팅하고, x축 색과 y축 색을 빨간색으로 설정합니다. 두 번째 타일에서 이 과정을 반복합니다.
t = tiledlayout(2,1);

% First tile
ax1 = nexttile;
plot([1 2 3 4 5],[11 6 10 4 18]);
ax1.XColor = [1 0 0];
ax1.YColor = [1 0 0];

% Second tile
ax2 = nexttile;
plot([1 2 3 4 5],[5 1 12 9 2],'o');
ax2.XColor = [1 0 0];
ax2.YColor = [1 0 0];
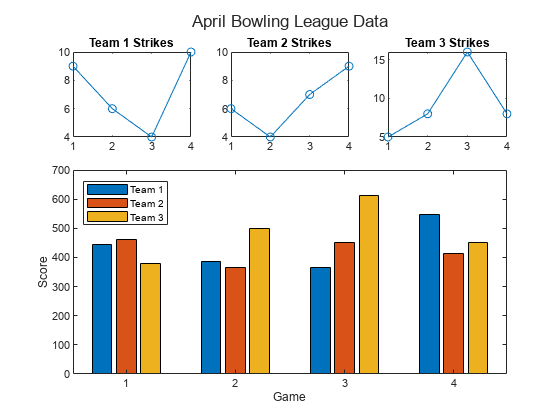
scores와 strikes를 네 차례의 볼링 리그 경기 데이터를 포함하는 벡터로 정의합니다. 그런 다음 타일 형식 차트 레이아웃을 만들고 각 팀의 스트라이크 횟수를 보여주는 3개의 플롯을 표시합니다.
scores = [444 460 380
          387 366 500
          365 451 611
          548 412 452];

strikes = [9  6  5
           6  4  8
           4  7  16
           10 9  8];

t = tiledlayout('flow');

% Team 1
nexttile
plot([1 2 3 4],strikes(:,1),'-o')
title('Team 1 Strikes')

% Team 2
nexttile
plot([1 2 3 4],strikes(:,2),'-o')
title('Team 2 Strikes')

% Team 3
nexttile
plot([1 2 3 4],strikes(:,3),'-o')
title('Team 3 Strikes')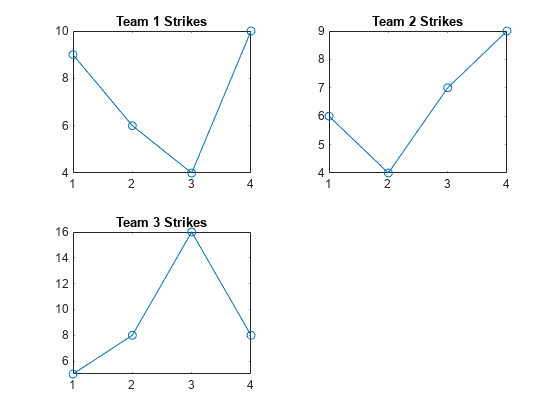
nexttile 함수를 호출하여 2개 행과 3개 열에 걸쳐 있는 axes 객체를 만듭니다. 그리고 막대 그래프를 범례와 함께 좌표축에 표시하고 축 눈금 값과 레이블을 구성합니다. title 함수를 호출하여 레이아웃에 타일을 추가합니다.
nexttile([2 3]);
bar([1 2 3 4],scores)
legend('Team 1','Team 2','Team 3','Location','northwest')

% Configure ticks and axis labels
xticks([1 2 3 4])
xlabel('Game')
ylabel('Score')

% Add layout title
title(t,'April Bowling League Data')
특정 위치에서 axes 객체 범위를 지정하려면 타일 번호와 범위 값을 지정하십시오.
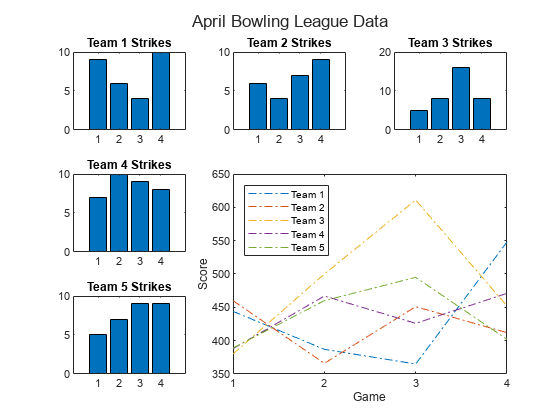
scores와 strikes를 네 차례의 볼링 리그 경기 데이터를 포함하는 벡터로 정의합니다. 그런 다음 3×3 타일 형식 차트 레이아웃을 만들고 각 팀의 스트라이크 횟수를 보여주는 다섯 개의 막대 그래프를 표시합니다.
scores = [444 460 380 388 389
          387 366 500 467 460
          365 451 611 426 495
          548 412 452 471 402];

strikes = [9  6  5  7  5
           6  4  8 10  7
           4  7 16  9  9
           10  9  8  8  9];

t = tiledlayout(3,3);

% Team 1
nexttile
bar([1 2 3 4],strikes(:,1))
title('Team 1 Strikes')

% Team 2
nexttile
bar([1 2 3 4],strikes(:,2))
title('Team 2 Strikes')

% Team 3
nexttile
bar([1 2 3 4],strikes(:,3))
title('Team 3 Strikes')

% Team 4
nexttile
bar([1 2 3 4],strikes(:,4))
title('Team 4 Strikes')

% Team 5
nexttile(7)
bar([1 2 3 4],strikes(:,5))
title('Team 5 Strikes')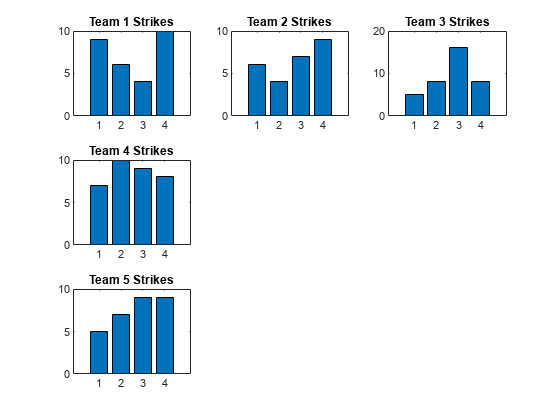
범례가 있는 큰 플롯을 표시합니다. nexttile 함수를 호출하여 좌표축의 왼쪽 위 코너를 다섯 번째 타일에 배치하고, 타일 2개 행과 2개 열에 걸쳐 좌표축을 배치합니다. 모든 팀의 점수를 플로팅합니다. x축에 네 개의 눈금이 표시되도록 구성하고, 각 축에 레이블을 추가합니다. 그런 다음 레이아웃 상단에 공통 제목을 추가합니다.
nexttile(5,[2 2]);
plot([1 2 3 4],scores,'-.')
labels = {'Team 1','Team 2','Team 3','Team 4','Team 5'};
legend(labels,'Location','northwest')

% Configure ticks and axis labels
xticks([1 2 3 4])
xlabel('Game')
ylabel('Score')

% Add layout title
title(t,'April Bowling League Data')
1×2 타일 형식 차트 레이아웃을 만듭니다. 첫 번째 타일 안에 지도상에서 두 도시를 연결하는 선을 포함하는 지리 플롯을 표시합니다. 두 번째 타일 안에 극좌표 형식의 산점도 플롯을 만듭니다.
tiledlayout(1,2)

% Display geographic plot
nexttile
geoplot([47.62 61.20],[-122.33 -149.90],'g-*')

% Display polar plot
nexttile
theta = pi/4:pi/4:2*pi;
rho = [19 6 12 18 16 11 15 15];
polarscatter(theta,rho)

nexttile 출력 인수는 이전 타일의 내용을 조정하려는 경우에 유용하게 사용할 수 있습니다. 예를 들어, 이전 플롯에서 사용된 컬러맵을 재구성할 수 있습니다.
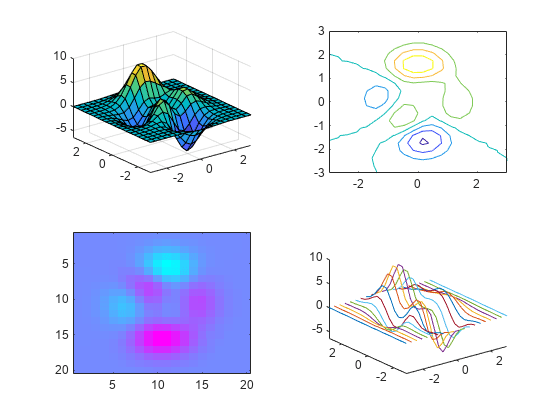
2×2 타일 형식 차트 레이아웃을 만듭니다. peaks 함수를 호출하여 미리 정의된 곡면의 좌표를 가져옵니다. 그런 다음 각 타일 안에 다른 곡면 플롯을 만듭니다.
tiledlayout(2,2);
[X,Y,Z] = peaks(20);

% Tile 1
nexttile
surf(X,Y,Z)

% Tile 2
nexttile
contour(X,Y,Z)

% Tile 3
nexttile
imagesc(Z)

% Tile 4
nexttile
plot3(X,Y,Z)

세 번째 타일의 컬러맵을 변경하려면 해당 타일의 좌표축을 가져오십시오. 타일 번호를 지정하여 nexttile 함수를 호출하고 axes 출력 인수를 반환합니다. 그런 다음 이 좌표축을 colormap 함수에 전달합니다.
ax = nexttile(3);
colormap(ax,cool)
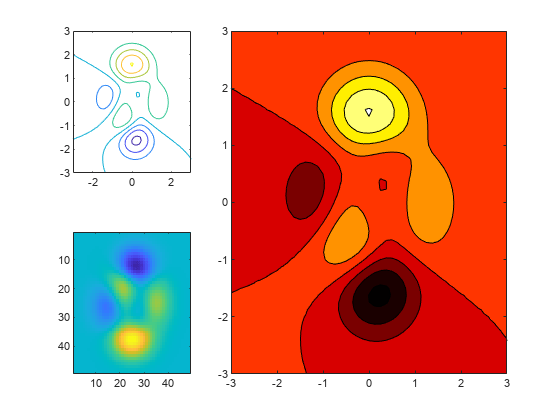
2×3 타일 형식 차트 레이아웃을 만들고 두 개의 플롯은 두 타일에 각각 포함시키고, 하나의 플롯은 2개 행과 2개 열에 걸치도록 합니다.
t = tiledlayout(2,3);
[X,Y,Z] = peaks;

% Tile 1
nexttile
contour(X,Y,Z)

% Span across two rows and columns
nexttile([2 2])
contourf(X,Y,Z)

% Last tile
nexttile
imagesc(Z)
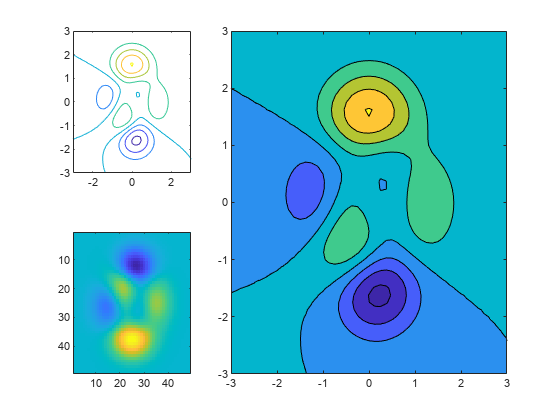
걸쳐 있는 좌표축의 컬러맵을 변경하려면 해당 타일의 위치를 좌표축의 왼쪽 위 코너를 포함하는 타일로 식별하십시오. 이 경우 왼쪽 위 코너는 두 번째 타일에 있습니다. 타일 위치로 2를 지정하여 nexttile 함수를 호출하고 출력 인수를 지정하여 해당 위치에 있는 axes 객체를 반환합니다. 그런 다음 이 좌표축을 colormap 함수에 전달합니다.
ax = nexttile(2);
colormap(ax,hot)
patients 데이터 세트를 불러오고 변수 일부로 테이블을 만듭니다. 2×2 타일 형식 차트 레이아웃을 만듭니다. 첫 번째 타일에 산점도 플롯을 표시하고, 두 번째 타일에 히트맵을 표시하고, 하단 두 개의 타일에 걸쳐 누적 플롯을 표시합니다.
load patients
tbl = table(Diastolic,Smoker,Systolic,Height,Weight,SelfAssessedHealthStatus);
tiledlayout(2,2)

% Scatter plot
nexttile
scatter(tbl.Height,tbl.Weight)

% Heatmap
nexttile
heatmap(tbl,'Smoker','SelfAssessedHealthStatus','Title','Smoker''s Health');

% Stacked plot
nexttile([1 2])
stackedplot(tbl,{'Systolic','Diastolic'});

타일 번호를 1로 지정하여 nexttile을 호출하고 해당 타일에 있는 좌표축을 현재 좌표축으로 만듭니다. 해당 타일의 내용을 산점도 히스토그램으로 바꿉니다.
nexttile(1)
scatterhistogram(tbl,'Height','Weight');
둘 이상의 플롯에서 컬러바 또는 범례를 공유하려면 별도의 타일에 배치하면 됩니다.
타일 형식 차트 레이아웃에 peaks 및 membrane 데이터 세트를 사용하여 채워진 등고선 플롯을 만듭니다.
Z1 = peaks;
Z2 = membrane;
tiledlayout(2,1);
nexttile
contourf(Z1)
nexttile
contourf(Z2)
컬러바를 추가하고 이 컬러바를 동쪽 타일로 이동합니다.
cb = colorbar;
cb.Layout.Tile = 'east';
경우에 따라 좌표축 함수(axes, polaraxes 또는 geoaxes)를 호출하여 좌표축을 만들어야 할 수 있습니다. 이러한 함수로 좌표축을 만들 경우 parent 인수를 타일 형식 차트 레이아웃으로 지정하십시오. 그런 다음 좌표축의 Layout 속성을 설정하여 좌표축의 위치를 지정합니다.
타일 형식 차트 레이아웃 t를 만들고 'flow' 타일 배열을 지정합니다. 처음 세 개 타일 각각에 플롯을 표시합니다.
t = tiledlayout('flow');
nexttile
plot(rand(1,10));
nexttile
plot(rand(1,10));
nexttile
plot(rand(1,10));
parent 인수로 t를 지정하여 geoaxes 함수를 호출하고 geographic axes 객체 gax를 만듭니다. 좌표축은 기본적으로 첫 번째 타일에 배치되므로, gax.Layout.Tile을 4로 설정하여 네 번째 타일로 이동합니다. gax.Layout.TileSpan을 [2 3]으로 설정하여 좌표축을 2×3 영역으로 구성된 타일에 배치합니다.
gax = geoaxes(t);
gax.Layout.Tile = 4;
gax.Layout.TileSpan = [2 3];
geoplot 함수를 호출합니다. 그런 다음 지도의 중심과 좌표축의 확대/축소 수준을 구성합니다.
geoplot(gax,[47.62 61.20],[-122.33 -149.90],'g-*')
gax.MapCenter = [47.62 -122.33];
gax.ZoomLevel = 2;
임의의 데이터로 구성된 6개의 플롯을 표시하기 위해 타일 형식 차트 레이아웃을 만듭니다. 모든 6개 플롯이 공유하는 좌표축 도구 모음을 만들려면 tiled chart layout 객체를 첫 번째 인수로 하여 axtoolbar 함수를 호출합니다.
tcl = tiledlayout;
tb = axtoolbar(tcl, {"export","pan","zoom","datacursor","brush","restoreview"}, Expanded="on");

for i = 1:6
    nexttile
    plot(rand(20,1))
end
입력 인수
이름-값 인수
선택적 인수 쌍을 Name1=Value1,...,NameN=ValueN으로 지정합니다. 여기서 Name은 인수 이름이고 Value는 대응값입니다. 이름-값 인수는 다른 인수 뒤에 와야 하지만, 인수 쌍의 순서는 상관없습니다.
예: tiledlayout(2,2,"TileSpacing","compact")는 타일 사이의 간격이 최소인 2×2 레이아웃을 만듭니다.
참고
여기에 나와 있는 속성은 일부에 불과합니다. 전체 목록을 보려면 TiledChartLayout 속성을 참조하십시오.
타일 간격으로, "loose", "compact", "tight" 또는 "none"으로 지정됩니다. 이 속성을 사용하여 타일 사이의 간격을 제어합니다.
다음 표에서는 각 값이 2×2 레이아웃 모양에 어떤 영향을 미치는지 보여줍니다.
| 값 | 모양 |
|---|---|
|
|
"compact" |
|
"tight" |
|
"none" |
|


레이아웃 주변 채우기로, "loose", "compact" 또는 "tight"로 지정됩니다. 레이아웃은 이 속성의 값에 관계없이 축 레이블과 같은 모든 장식을 위한 공간을 제공합니다.
다음 표에서는 각 값이 2×2 레이아웃 모양에 어떤 영향을 미치는지 보여줍니다.
| 값 | 모양 |
|---|---|
|
|
"compact" |
|
"tight" |
|


버전 내역
R2019b에 개발됨타일 형식 차트 레이아웃을 만들 때 TileSpacing 속성과 Padding 속성 중 일부가 다른 결과를 제공하거나 새 이름을 갖습니다.
새로운 TileSpacing 옵션은 "loose", "compact", "tight", "none"입니다. 새로운 Padding 옵션은 "loose", "compact", "tight"입니다. 다음 표에서는 이전 옵션과 새로운 옵션 사이의 관계를 보여줍니다.
TileSpacing 변경 내용
이전 TileSpacing 옵션 | R2021a TileSpacing 옵션 | 코드를 업데이트하는 방법 |
|---|---|---|
|
|
|
|
| 변경할 필요가 없습니다. |
| 해당 없음 |
|
|
|
|
플롯 상자 간의 간격을 유지하려면 |
Padding 변경 내용
이전 Padding 옵션 | R2021a Padding 옵션 | 코드를 업데이트하는 방법 |
|---|---|---|
|
|
|
|
| 변경할 필요가 없습니다. |
|
|
|