사용자 지정 속성을 테이블 및 타임테이블에 추가하기
이 예제에서는 사용자 지정 속성을 테이블 및 타임테이블에 추가하고, 속성값을 설정하거나 제거하고, 속성값에 액세스하는 방법을 보여줍니다.
모든 테이블과 타임테이블은 자신에 대한 메타데이터 혹은 자신이 가진 변수에 대한 메타데이터가 포함된 속성을 가집니다. T.Properties 객체를 통해 이러한 속성에 액세스할 수 있습니다. 여기서 T는 테이블 또는 타임테이블의 이름입니다. 예를 들어, T.Properties.VariableNames는 T의 변수 이름을 포함하는 셀형 배열을 반환합니다.
T.Properties를 통해 table 데이터형 및 timetable 데이터형을 정의하는 속성에 액세스할 수 있습니다. 이러한 미리 정의된 속성은 추가하거나 제거할 수 없습니다. 그러나 테이블 또는 타임테이블의 T.Properties.CustomProperties 객체를 수정하여 자체적인 사용자 지정 속성을 추가하고 제거할 수 있습니다.
속성 추가하기
정전 데이터를 테이블로 읽어옵니다. 날짜와 시간을 포함하고 있는 첫 번째 변수인 OutageTime을 사용하여 데이터를 정렬합니다.
T = readtable("outages.csv",TextType="string");
T = sortrows(T,"OutageTime")
T=1468×6 table
      Region          OutageTime        Loss     Customers     RestorationTime           Cause
    ___________    ________________    ______    __________    ________________    __________________

    "SouthWest"    2002-02-01 12:18    458.98    1.8202e+06    2002-02-07 16:50    "winter storm"
    "MidWest"      2002-03-05 17:53    96.563    2.8666e+05    2002-03-10 14:41    "wind"
    "MidWest"      2002-03-16 06:18    186.44    2.1275e+05    2002-03-18 23:23    "severe storm"
    "MidWest"      2002-03-26 01:59    388.04    5.6422e+05    2002-03-28 19:55    "winter storm"
    "MidWest"      2002-04-20 16:46     23141           NaN                 NaT    "unknown"
    "SouthWest"    2002-05-08 20:34    50.732         34481    2002-05-08 22:21    "thunder storm"
    "MidWest"      2002-05-18 11:04    1389.1    1.3447e+05    2002-05-21 01:22    "unknown"
    "NorthEast"    2002-05-20 10:57    9116.6    2.4983e+06    2002-05-21 15:22    "unknown"
    "SouthEast"    2002-05-27 09:44    237.28    1.7101e+05    2002-05-27 16:19    "wind"
    "SouthEast"    2002-06-02 16:11         0             0    2002-06-05 05:55    "energy emergency"
    "West"         2002-06-06 19:28    311.86           NaN    2002-06-07 00:51    "equipment fault"
    "SouthEast"    2002-06-17 23:01    42.542         39877    2002-06-17 23:49    "thunder storm"
    "MidWest"      2002-07-01 04:33    203.94         60650    2002-07-02 14:54    "severe storm"
    "MidWest"      2002-07-01 08:18    100.71    1.8116e+05    2002-07-01 11:33    "severe storm"
    "MidWest"      2002-07-10 01:49    168.02           NaN    2002-07-10 17:20    "equipment fault"
    "SouthEast"    2002-07-14 21:32     90.83         60133    2002-07-14 23:53    "thunder storm"
      ⋮
해당 속성을 표시합니다. 이는 모든 테이블이 공통적으로 갖는 속성입니다. CustomProperties 객체가 있긴 하지만 기본적으로 속성이 없음을 볼 수 있습니다.
T.Properties
ans =
  TableProperties with properties:

             Description: ''
                UserData: []
          DimensionNames: {'Row'  'Variables'}
           VariableNames: {'Region'  'OutageTime'  'Loss'  'Customers'  'RestorationTime'  'Cause'}
           VariableTypes: ["string"    "datetime"    "double"    "double"    "datetime"    "string"]
    VariableDescriptions: {}
           VariableUnits: {}
      VariableContinuity: []
                RowNames: {}
        CustomProperties: No custom properties are set.
      Use addprop and rmprop to modify CustomProperties.
사용자 지정 속성을 추가하려면 addprop 함수를 사용하십시오. 속성 이름을 지정합니다. 또한, 각 속성마다 전체 테이블에 대한 메타데이터(Description 속성과 유사함)를 포함할지 또는 해당 변수에 대한 메타데이터(VariableNames 속성과 유사함)를 포함할지를 지정합니다. 속성이 변수에 대한 메타데이터를 가지는 경우에는 그 값이 벡터여야 하며 길이는 변수 개수와 동일해야 합니다.
출력 파일 이름, 파일 형식, 플로팅할 변수를 나타내는 표시자를 포함하는 사용자 지정 속성을 추가합니다. 가장 좋은 방법은 사용자 지정 속성이 동일한 테이블에 속하도록 입력 테이블을 addprop의 출력 인수로 할당하는 것입니다. "table" 옵션을 사용하여 출력 파일 이름과 파일 형식이 테이블 메타데이터가 되도록 지정합니다. "variable" 옵션을 사용하여 플롯 표시자가 변수 메타데이터가 되도록 지정합니다.
T = addprop(T,["OutputFileName" "OutputFileType" "ToPlot"], ...
              ["table" "table" "variable"]);
T.Properties
ans =
  TableProperties with properties:

             Description: ''
                UserData: []
          DimensionNames: {'Row'  'Variables'}
           VariableNames: {'Region'  'OutageTime'  'Loss'  'Customers'  'RestorationTime'  'Cause'}
           VariableTypes: ["string"    "datetime"    "double"    "double"    "datetime"    "string"]
    VariableDescriptions: {}
           VariableUnits: {}
      VariableContinuity: []
                RowNames: {}

   Custom Properties (access using t.Properties.CustomProperties.<name>):
          OutputFileName: []
          OutputFileType: []
                  ToPlot: []
사용자 지정 속성의 값을 설정하고 액세스하기
addprop을 사용하여 사용자 지정 속성을 추가할 경우 기본적으로 해당 값은 빈 배열입니다. 점 구문을 사용하여 사용자 지정 속성의 값을 설정하고 액세스할 수 있습니다.
출력 파일 이름과 형식을 설정합니다. 이러한 속성은 테이블에 대한 메타데이터를 포함합니다. 그런 다음 논리형 배열을 ToPlot 속성에 할당합니다. 이 속성은 변수에 대한 메타데이터를 포함합니다. 이 예제에서 ToPlot 속성의 값 요소는 플롯에 포함시킬 각 변수의 경우에는 true이고, 제외시킬 각 변수의 경우에는 false입니다.
T.Properties.CustomProperties.OutputFileName = "outageResults";
T.Properties.CustomProperties.OutputFileType = ".mat";
T.Properties.CustomProperties.ToPlot = [false false true true true false];
T.Properties
ans =
  TableProperties with properties:

             Description: ''
                UserData: []
          DimensionNames: {'Row'  'Variables'}
           VariableNames: {'Region'  'OutageTime'  'Loss'  'Customers'  'RestorationTime'  'Cause'}
           VariableTypes: ["string"    "datetime"    "double"    "double"    "datetime"    "string"]
    VariableDescriptions: {}
           VariableUnits: {}
      VariableContinuity: []
                RowNames: {}

   Custom Properties (access using t.Properties.CustomProperties.<name>):
          OutputFileName: "outageResults"
          OutputFileType: ".mat"
                  ToPlot: [0 0 1 1 1 0]
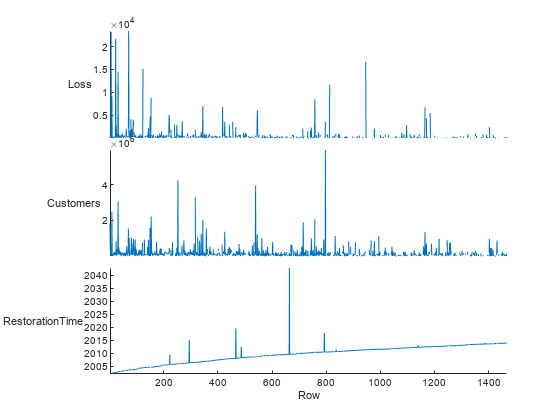
stackedplot 함수를 사용하여 누적 플롯에서 T의 변수를 플로팅합니다. Loss, Customers, RestorationTime 값만 플로팅하려면 ToPlot 사용자 지정 속성을 두 번째 입력 인수로 사용하십시오.
stackedplot(T,T.Properties.CustomProperties.ToPlot);
테이블 변수를 이동하거나 삭제하면 해당 값이 동일한 변수에 대응되도록 미리 정의된 속성과 사용자 지정 속성이 모두 재정렬됩니다. 이 예제를 보면 ToPlot 사용자 지정 속성의 값들이 앞서 플로팅하도록 표시된 변수에 맞춰 재정렬되어 있으며, 마찬가지로 미리 정의된 속성인 VariableNames의 값들도 재정렬된 상태입니다.
Customers 변수를 제거한 다음 속성을 표시합니다.
T.Customers = [];
T.Properties
ans =
  TableProperties with properties:

             Description: ''
                UserData: []
          DimensionNames: {'Row'  'Variables'}
           VariableNames: {'Region'  'OutageTime'  'Loss'  'RestorationTime'  'Cause'}
           VariableTypes: ["string"    "datetime"    "double"    "datetime"    "string"]
    VariableDescriptions: {}
           VariableUnits: {}
      VariableContinuity: []
                RowNames: {}

   Custom Properties (access using t.Properties.CustomProperties.<name>):
          OutputFileName: "outageResults"
          OutputFileType: ".mat"
                  ToPlot: [0 0 1 1 0]
정전 시간을 행 시간값으로 사용하여 테이블을 타임테이블로 변환합니다. movevars 함수를 사용하여 Region을 테이블의 끝으로 이동하고, RestorationTime을 첫 번째 변수 앞으로 이동합니다. 참고로, 속성은 적절하게 재정렬됩니다. RestorationTime 변수와 Loss 변수에는 여전히 플롯에 포함하도록 표시하는 표시자가 있습니다.
T = table2timetable(T);
T = movevars(T,"Region",After="Cause");
T = movevars(T,"RestorationTime",Before=1);
T.Properties
ans =
  TimetableProperties with properties:

             Description: ''
                UserData: []
          DimensionNames: {'OutageTime'  'Variables'}
           VariableNames: {'RestorationTime'  'Loss'  'Cause'  'Region'}
           VariableTypes: ["datetime"    "double"    "string"    "string"]
    VariableDescriptions: {}
           VariableUnits: {}
      VariableContinuity: []
                RowTimes: [1468×1 datetime]
               StartTime: 2002-02-01 12:18
              SampleRate: NaN
                TimeStep: NaN
                  Events: []

   Custom Properties (access using t.Properties.CustomProperties.<name>):
          OutputFileName: "outageResults"
          OutputFileType: ".mat"
                  ToPlot: [1 1 0 0]
속성 제거하기
rmprop 함수를 사용하여 테이블의 사용자 지정 속성 중 일부 또는 전체를 제거할 수 있습니다. 그러나 T.Properties의 미리 정의된 속성은 table 데이터형 정의의 일부이므로 이 함수를 사용하여 이러한 속성을 제거할 수는 없습니다.
OutputFileName 사용자 지정 속성과 OutputFileType 사용자 지정 속성을 제거합니다. 남아 있는 테이블 속성을 표시합니다.
T = rmprop(T,["OutputFileName" "OutputFileType"]);
T.Properties
ans =
  TimetableProperties with properties:

             Description: ''
                UserData: []
          DimensionNames: {'OutageTime'  'Variables'}
           VariableNames: {'RestorationTime'  'Loss'  'Cause'  'Region'}
           VariableTypes: ["datetime"    "double"    "string"    "string"]
    VariableDescriptions: {}
           VariableUnits: {}
      VariableContinuity: []
                RowTimes: [1468×1 datetime]
               StartTime: 2002-02-01 12:18
              SampleRate: NaN
                TimeStep: NaN
                  Events: []

   Custom Properties (access using t.Properties.CustomProperties.<name>):
                  ToPlot: [1 1 0 0]
참고 항목
readtable | table | head | addprop | table2timetable | movevars | rmprop | sortrows | stackedplot