앱에서 테이블 형식 데이터의 형식 지정하기
table형 배열은 테이블 형식 데이터를 MATLAB® 변수로 저장하는 데 유용합니다. 예를 들어, readtable 함수를 호출하여 스프레드시트로부터 table형 배열을 만들 수 있습니다. Table UI 컴포넌트를 사용하면 앱에 table형 배열 데이터를 표시하고 일부 데이터형에 대화형 편집 기능을 활용할 수 있습니다. 앱 디자이너로 만든 앱 및 uifigure 함수로 만든 Figure만 Table UI 컴포넌트에서 table형 배열을 사용할 수 있습니다.
앱 디자이너를 사용하여 테이블 형식 데이터를 표시하는 경우 먼저 디자인 뷰에서 Table UI 컴포넌트를 만듭니다. 그런 다음 이 페이지의 예제를 사용하여 데이터 형식을 지정하고 코드 뷰에서 Table UI 컴포넌트의 속성을 설정합니다. 앱 디자이너에서 테이블을 사용하는 방법에 대한 자세한 내용은 앱 디자이너로 만든 앱에 테이블 추가하기 항목을 참조하십시오.
테이블 컴포넌트에서 이러한 데이터형 중 일부를 사용하는 완전하게 코딩된 예제 앱을 보려면 앱에서 대화형 방식의 테이블 만들기 항목을 참조하십시오.
숫자형 데이터
Table UI 컴포넌트에서 숫자형 데이터의 값은 오른쪽 정렬로 표시됩니다.
fig = uifigure;
tdata = table([10; 1; 5],[12; 7; 38]);
uit = uitable(fig,'Data',tdata);
uit.Position(3) = 200;
uit.RowName = 'numbered';

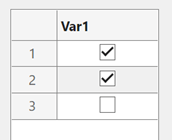
논리형 데이터
논리값은 체크박스로 표시됩니다. true 값은 선택된 체크박스로, false 값은 선택되지 않은 체크박스로 표시됩니다. Table UI 컴포넌트의 ColumnEditable 속성이 true이면 사용자는 앱에서 체크박스를 선택하거나 선택을 해제할 수 있습니다.
fig = uifigure;
tdata = table([true; true; false]);
uit = uitable(fig,'Data',tdata);
uit.Position(3) = 130;
uit.RowName = 'numbered';
categorical형 데이터
categorical형 값은 드롭다운 목록 또는 텍스트로 표시될 수 있습니다. Table UI 컴포넌트의 ColumnEditable 속성이 true이면 범주가 드롭다운 목록에 표시됩니다. 그렇지 않으면, 범주는 드롭다운 목록 없이 텍스트로 표시됩니다.
fig = uifigure;
cnames = categorical({'Blue';'Red'},{'Blue','Red'});
w = [400; 700];
tdata = table(cnames,w,'VariableNames',{'Color','Wavelength'});
uit = uitable(fig,'Data',tdata,'ColumnEditable',true);
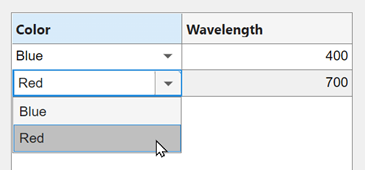
categorical형 배열이 보호되지 않는 경우, 사용자는 실행 중인 앱에서 셀에 새 범주를 입력하여 추가할 수 있습니다.
datetime형 데이터
datetime형 값은 해당 테이블 변수(datetime 배열)의 Format 속성에 따라 표시됩니다.
fig = uifigure;
dates = datetime([2016,01,17; 2017,01,20],'Format','MM/dd/uuuu');
m = [10; 9];
tdata = table(dates,m,'VariableNames',{'Date','Measurement'});
uit = uitable(fig,'Data',tdata);
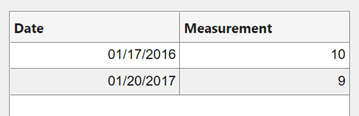
형식을 변경하려면 점 표기법을 사용하여 테이블 변수의 Format 속성을 설정하십시오. 그런 다음, Table UI 컴포넌트의 데이터를 바꿉니다.
tdata.Date.Format = 'dd/MM/uuuu';
uit.Data = tdata;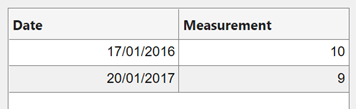
Table UI 컴포넌트의 ColumnEditable 속성이 true이면 사용자가 앱에서 날짜 값을 변경할 수 있습니다. 열 편집이 가능한 경우에는 앱에 datetime형 배열의 Format 속성을 따르는 값을 입력해야 합니다. 사용자가 유효하지 않은 날짜를 입력한 경우, 테이블에 NaT 값이 표시됩니다.
duration형 데이터
duration형 값은 해당 테이블 변수(duration 배열)의 Format 속성에 따라 표시됩니다.
fig = uifigure;
mtime = duration([0;0],[1;1],[20;30]);
dist = [10.51; 10.92];
tdata = table(mtime,dist,'VariableNames',{'Time','Distance'});
uit = uitable(fig,'Data',tdata);

형식을 변경하려면 점 표기법을 사용하여 테이블 변수의 Format 속성을 설정하십시오.
tdata.Time.Format = 's';
uit.Data = tdata;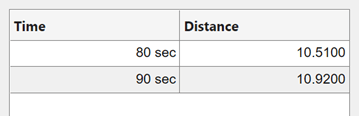
Table UI 컴포넌트의 ColumnEditable 속성이 true인 경우에도 실행 중인 앱에서 duration형 값이 포함된 셀은 편집할 수 없습니다.
비 스칼라 데이터
비 스칼라 값은 명령 창에서 표시되는 것과 같은 방식으로 앱에서도 표시됩니다. 예를 들어, 다음 table형 배열에는 3차원 배열과 struct형 배열이 포함되어 있습니다.
fig = uifigure;
arr = {rand(3,3,3); rand(3,3,3)};
s = {struct; struct};
tdata = table(arr,s,'VariableNames',{'Array','Structure'});
uit = uitable(fig,'Data',tdata);
다중 열 table형 배열 변수는 명령 창에서와 같이 앱에서도 결합된 열로 표시됩니다. 예를 들어, 다음 table형 배열의 RGB 변수는 3×3 배열입니다.
n = [1;2;3];
rgbs = [128 122 16; 0 66 155; 255 0 0];
tdata = table(n,rgbs,'VariableNames',{'ROI','RGB'})
tdata =

  3×2 table

    ROI           RGB
    ___    _________________

     1     128    122     16
     2       0     66    155
     3     255      0      0
Table UI 컴포넌트는 이와 유사하게 표시합니다. RGB 열에서 항목을 선택하면 해당 행의 하위 열이 모두 선택됩니다. Table UI 컴포넌트의 ColumnEditable 속성이 true인 경우에도 실행 중인 앱에서 하위 열의 값을 편집할 수 없습니다.
fig = uifigure;
uit = uitable(fig,'Data',tdata);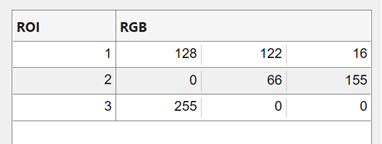
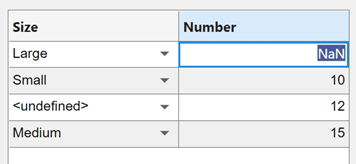
누락된 데이터 값
누락값은 데이터형에 따라 표시자로 표시됩니다.
누락값인 string형은
<missing>으로 표시됩니다.정의되지 않은
categorical형 값은<undefined>로 표시됩니다.유효하지 않거나 정의되지 않은 숫자 또는
duration형 값은NaN으로 표시됩니다.유효하지 않거나 정의되지 않은
datetime형 값은NaT로 표시됩니다.
Table UI 컴포넌트의 ColumnEditable 속성이 true이면 사용자는 실행 중인 앱에서 값을 수정할 수 있습니다.
fig = uifigure;
sz = categorical([1; 3; 4; 2],1:3,{'Large','Medium','Small'});
num = [NaN; 10; 12; 15];
tdata = table(sz,num,'VariableNames',{'Size','Number'});
uit = uitable(fig,'Data',tdata,'ColumnEditable',true);