spectralIndices
Compute spectral indices
Syntax
Description
Add-On Required: This feature requires the Hyperspectral Imaging Library for Image Processing Toolbox add-on.
indices = spectralIndices(spcube)spcube to compute the greenness indices.
indices = spectralIndices(spcube,indexNames)indexNames.
indices = spectralIndices(___,BlockSize=blocksize)
The function divides the input image into distinct blocks,
processes each block, and then concatenates the processed output of each block to form the
output matrix. Spectral images are multi-dimensional data sets that can be too large to fit in
system memory in their entirety. This can cause the system to run out of memory while running
the spectralIndices function. If you encounter such an issue, perform block
processing by using this syntax.
For example, spectralIndices(spcube,BlockSize=[50 50]) divides the
input image into non-overlapping blocks of size 50-by-50 and then computes the spectral
indices for pixels in each block.
Note
The Hyperspectral Imaging Library for Image Processing Toolbox™ requires desktop MATLAB®, as MATLAB Online™ and MATLAB Mobile™ do not support the library.
Examples
Read hyperspectral data into the workspace.
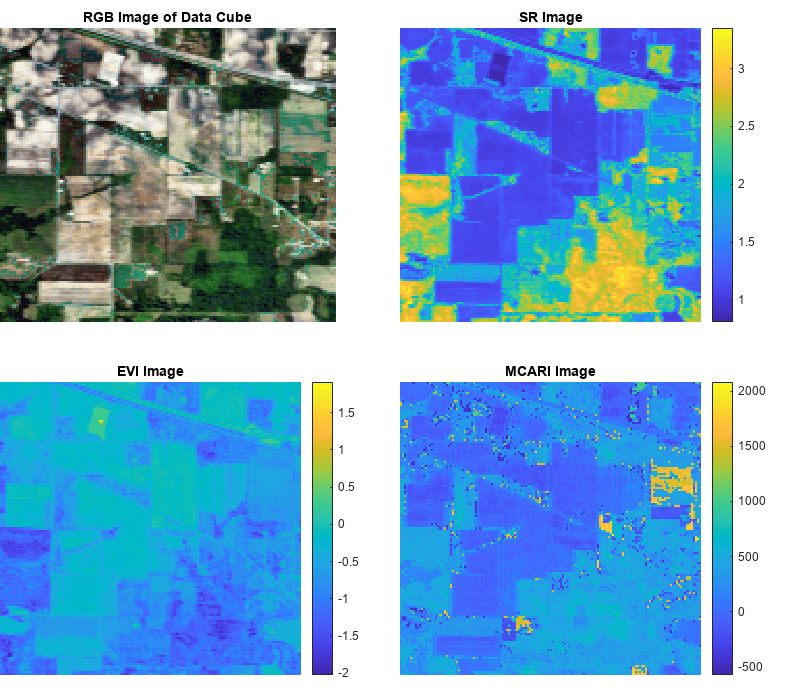
hcube = imhypercube("indian_pines.dat");Compute the spectral indices value for each pixel in the data cube. By default, the spectralIndices function returns the simple ratio (SR) index, enhanced vegetation index (EVI), and modified chlorophyll absorption ratio index (MCARI).
indices = spectralIndices(hcube);
Inspect the index names in the output struct indices. Read the corresponding index images returned at the output.
indices.IndexName
ans =
"Simple Ratio (SR)"
ans =
"Enhanced Vegetation Index (EVI)"
ans =
"Modified Chlorophyll Absorption Ratio Index (MCARI)"
srImg = indices(1).IndexImage;
eviImg = indices(2).IndexImage;
mcariImg = indices(3).IndexImage;
Estimate a contrast-stretched RGB image from the original data cube by using the colorize function.
rgbImg = colorize(hcube,Method="rgb",ContrastStretching=true);Display the original and the computed index images. The SR index value greater than 3 signifies vegetation. The EVI index identifies dense vegetation and the typical EVI index value for healthy vegetation lie between 0.2 and 0.8. MCARI index signifies abundance of chlorophyll in a region.
fig = figure(Position=[0 0 800 700]);

axes1 = axes(Parent=fig,Position=[0 0.54 0.42 0.42]);
imagesc(rgbImg,Parent=axes1);
axis off
title("RGB Image of Data Cube")

axes2 = axes(Parent=fig,Position=[0.5 0.54 0.45 0.42]);
imagesc(srImg,Parent=axes2);
axis off
title("SR Image")
colorbar

axes3 = axes(Parent=fig,Position=[0 0.035 0.45 0.42]);
imagesc(eviImg,Parent=axes3);
axis off
title("EVI Image")
colorbar

axes4 = axes(Parent=fig,Position=[0.5 0.035 0.45 0.42]);
imagesc(mcariImg,Parent=axes4);
axis off
title("MCARI Image")
colorbar
Download Landsat 8 multispectral data.
zipfile = "LC08_L1TP_113082_20211206_20211215_02_T1.zip";
landsat8Data_url = "https://ssd.mathworks.com/supportfiles/image/data/" + zipfile;
hyper.internal.downloadLandsatDataset(landsat8Data_url,zipfile)
filepath = fullfile("LC08_L1TP_113082_20211206_20211215_02_T1","LC08_L1TP_113082_20211206_20211215_02_T1_MTL.txt");
Read a multispectral image into the workspace, and resample it to a uniform resolution.
mcube = immulticube(filepath);
mcube = resampleBands(mcube,30);
Compute the MNDWI value for each pixel in the data cube and read the water index image.
indices = spectralIndices(mcube,"MNDWI");
mndwiImg = indices.IndexImage;
Estimate a contrast-stretched RGB image from the original data cube by using the colorize function.
rgbImg = colorize(mcube);
Display the original and the MNDWI image.
fig = figure(Position=[0 0 700 400]);
axes1 = axes(Parent=fig,Position=[0 0.1 0.4 0.8]);
imshow(rgbImg,Parent=axes1)
title("RGB Image of Data Cube")
axes2 = axes(Parent=fig,Position=[0.45 0.15 0.47 0.7]);
imagesc(mndwiImg,Parent=axes2)
colorbar
axis off
title("MNDWI Image")
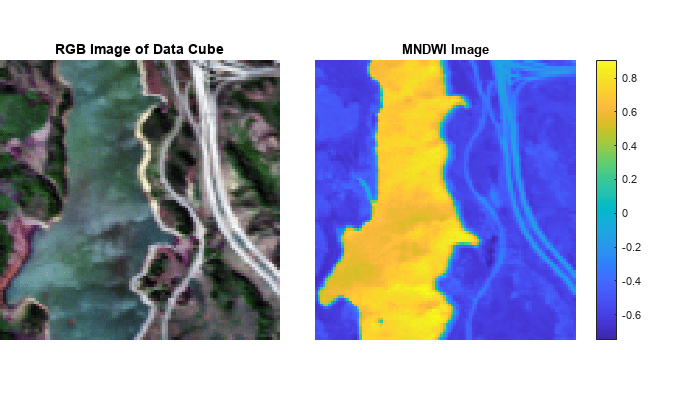
Water regions typically have MNDWI values greater than 0.09. Perform thresholding of MNDWI image to segment the water regions. Specify the threshold value.
threshold = 0.09;
Create a binary image by applying the threshold. The regions in the binary image with a value of 1 correspond to the vegetation regions in the data cube with MNDWI values greater than the threshold. All other pixels have a value 0.
bw = mndwiImg > threshold;
Overlay the binary image on to the RGB image and display the overlaid image.
overlayImg = imoverlay(rgbImg,bw,[0 0 1]);
figure
imagesc(overlayImg)
axis off
title("Water Region Overlaid on RGB Image")
