truth 데이터를 분석하고 truth 모델 정의하기
이 예제에서는 기록된 truth 데이터를 분석하여 truth 객체의 모션을 모델링하고 이를 추적하는 필터를 구성하는 방법을 보여줍니다.
truth 데이터의 소스와 유형
기록되는 truth 데이터의 소스는 일반적으로 세 가지입니다.
시뮬레이션: 시뮬레이션된 시나리오를 실행하고 각 truth 객체의 기구학을 기록하는 방식으로 데이터를 수집합니다. 기록된 데이터는 완벽하고 잡음이 없으며 어떤 업데이트 속도에서도 얻을 수 있습니다. 또한 임의의 기구학 시간 도함수를 기록할 수 있다는 점에서 완전합니다.
계측된 테스트: 비행 테스트 중에 GPS 및 관성 측정 장치를 사용하여 관심 truth 객체를 계측하는 방식으로 데이터를 수집합니다. 기록된 데이터는 일반적으로 잡음이 적고, 약 1Hz에서 기록되며, 주로 위치와 속도만 포함되는 제한적인 수의 기구학 도함수를 포함합니다.
레이블이 지정된 데이터: 예를 들어 도로 주행처럼 주로 통제되지 않은 테스트 동안 데이터를 수집합니다. 나중에 센서 데이터에 자동으로 혹은 반자동으로 레이블을 지정하여 truth의 추정값을 생성합니다. 이 데이터는 일반적으로 잡음 수준이 높고, 잘못된 식별이 포함될 수 있으며, 업데이트 속도가 다양할 수 있습니다.
이 예제에서는 시뮬레이션과 계측된 테스트에서 얻은 truth 객체의 기록을 분석하는 데 중점을 둡니다.
시뮬레이션된 truth 분석하기
이 섹션에서는 첫 번째 경우인 시뮬레이션에서 기록된 truth에 집중합니다. 이 예제는 [1]에 설명된 Benchmark Trajectories for Multi-Object Tracking 시나리오를 기반으로 합니다.
벤치마크 궤적 시나리오를 각 truth 객체에 대한 시간, 위치, 속도의 이력을 나열하는 테이블로 변환합니다. 함수 scenarioToTruth는 이 스크립트의 하단에 있는 지원 함수에서 제공됩니다.
load("TruthScenario","scenario"); updateRate =10; includeVelocity =
true; includeAcceleration =
false; truthTables = scenarioToTruth(scenario,UpdateRate=updateRate,includeVelocity=includeVelocity,IncludeAcceleration=includeAcceleration);
truth 궤적을 시각화합니다.
f = figure;
hold on;
for i = 1:numel(truthTables)
    scatter3(truthTables{i}.Position(:,2),truthTables{i}.Position(:,1),-truthTables{i}.Position(:,3),1,lines(1));
end
xlabel('East [m]');
ylabel('North [m]');
zlabel('Up [m]');
view(3);
axis equal;
![Figure contains an axes object. The axes object with xlabel East [m], ylabel North [m] contains 6 objects of type scatter.](../../examples/fusion/win64/AnalyzeTruthDataAndDefineTargetModelExample_01.png)
타깃이 빠르게 방향을 바꾸고 있으며, 이는 기동하는 타깃임을 의미합니다. 속도, 속도 변화율(접선 가속도), 회전(법선 가속도)을 살펴보면 타깃의 모션을 더 쉽게 분석할 수 있습니다. 이 스크립트에 연결된 함수 addManeuvers는 진리표를 분석하고 속도, 접선 가속도, 법선 가속도를 추가합니다.
기동을 분석하고 테이블에 추가하는 과정에는 다음 단계가 포함됩니다.
속도와 가속도가 truth에 제공되지 않는 경우 간단한 도함수를 사용하여 데이터를 작성합니다. 시뮬레이션에서 얻은 완벽한 데이터이면 이 단계는 자명합니다.
속도 벡터의 노름을 사용하여 각 시간 스텝에서 속도를 계산합니다.
기록이 북쪽-동쪽-아래쪽 좌표이므로 상승률에는 속도의 z 성분을 사용합니다.
각 시간 스텝의 속도 벡터와 가속도 벡터를 사용하여 해당 시간 스텝의 접선 가속도를 구합니다.
가속도의 노름과 접선 가속도로부터 법선 가속도를 계산합니다.
truthTables = addManeuvers(truthTables);
이제 이 스크립트에 연결된 plotManeuvers 함수를 사용하여 기동을 더 쉽게 관찰할 수 있습니다. minat 값과 minan 값을 사용하여 기동으로 간주되는 최소 접선 가속도와 최소 법선 가속도를 각각 정의합니다. 이 그림에서 파란색 구간은 가속이 없는 등속도 구간, 녹색 구간은 속도가 증가하면서 직선을 따라 비행하는 구간, 빨간색 구간은 속도가 감소하면서 직선을 따라 비행하는 구간, 노란색 구간은 회전하는 구간을 나타냅니다.
minat =1; % Minimum tangential acceleration, m/s^2 minan =
1; % Minimum normal acceleration, m/s^2 plotManeuvers(f,truthTables,minat,minan);
![Figure contains an axes object. The axes object with xlabel East [m], ylabel North [m] contains 6 objects of type scatter.](../../examples/fusion/win64/AnalyzeTruthDataAndDefineTargetModelExample_02.png)
이 스크립트에 연결된 summarizeManeuvers 함수를 사용하여 각 타깃에 대한 기동 한계를 요약합니다. 타깃은 속도를 바꾸면서 동시에 회전할 수 있으므로 테이블의 백분율은 총합이 100이 되지 않을 수 있습니다.
summaryTable = summarizeManeuvers(truthTables,minat,minan)
summaryTable=6×10 table
    Constant Velocity %    Turn %    Speed Change %    Min Speed    Max Speed    Min Climb Rate    Max Climb Rate    Min Tangential Acceleration    Max Tangential Acceleration    Max Normal Acceleration
    ___________________    ______    ______________    _________    _________    ______________    ______________    ___________________________    ___________________________    _______________________

          76.661           23.339             0         289.34       289.71                0                 0                -0.33228                        0.38319                      35.447
          74.446           25.338        3.7277         301.06       305.69          -32.286          0.023165                 -5.4425                         5.2036                      41.087
          73.582            17.45        20.367          274.3       458.75                0                 0                   -14.9                          5.023                      44.198
          56.942           19.287        36.629         251.45       411.71         -0.74238            55.382                 -3.2049                          7.253                      59.918
          32.037           33.117        60.238         274.46       453.79          -1.8727            281.49                  -40.11                         40.893                      72.883
          41.221           28.795        55.592         208.87       426.84          -167.82             1.074                 -13.831                         11.176                      72.561
기록된 truth 분석하기
지금까지의 분석에서는 시뮬레이션에서 얻은 완벽한 truth를 사용했습니다. 이 분석도 유용하지만, 테스트에서 타깃을 계측하고 GPS 위치를 기록 및 분석하는 것이 더 일반적입니다.
기록된 truth에는 자체에 내재된 계측 잡음이 있고, 업데이트 속도가 느리며, 종종 누락된 계측값을 포함합니다.
이 예제에서는 gpsSensor System object와 헬퍼 simulateRecording 함수를 사용하여 이러한 효과를 시뮬레이션합니다.
sampleRate =1 ; % Sampling rate of the instrumentation systems horizontalPositionAccuracy =
1.6; % Horizontal accuracy of the instrumentation systems verticalPositionAccuracy =
3; % Vertical accuracy of the instrumentation systems velocityAccuracy =
0.1; % Velocity accuracy of the instrumentation systems decayFactor =
0.9; % Decay factor of the instrumentation systems gps = gpsSensor(SampleRate=sampleRate, ... HorizontalPositionAccuracy=horizontalPositionAccuracy, ... VerticalPositionAccuracy=verticalPositionAccuracy, ... VelocityAccuracy=velocityAccuracy, ... DecayFactor=decayFactor); recordingProbability =
0.9; % Probability of sample being reported recordedTables = simulateRecording(scenario,gps,recordingProbability);
잡음 있는 Truth 데이터 평활화하기
기록된 데이터에 잡음이 얼마나 많이 있는가에 따라, 데이터를 분석하기 전에 평활화를 수행하고 싶을 수 있습니다. 이는 선택적 단계입니다.
이를 수행하려면 MATLAB® 데이터 정리기 앱을 사용하여 데이터 평활화 옵션으로 기록을 평활화합니다. 이 이미지는 MATLAB 창에서 데이터 정리기 앱으로 이동하는 방법을 보여줍니다.

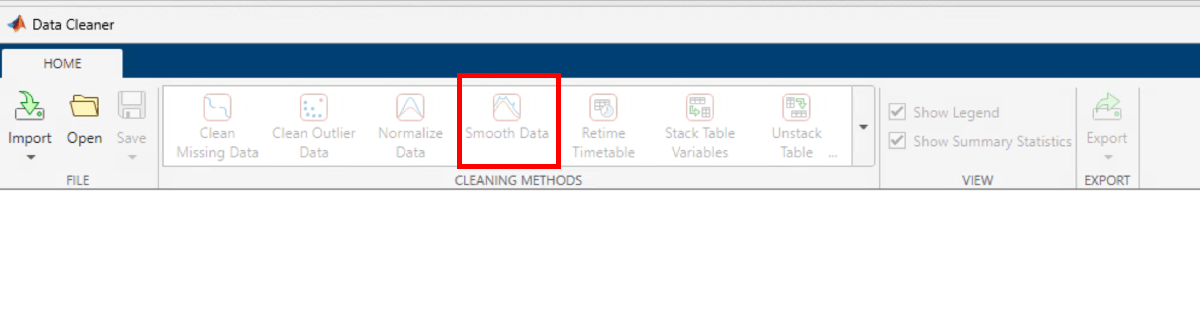
다음 이미지는 데이터 정리기 앱에서 데이터 평활화 툴을 찾는 방법을 보여줍니다.
앱에서 내보낸 smoothRecording 함수와 가우스 옵션을 사용하여 데이터를 평활화합니다. timewindow의 선택은 데이터 샘플 레이트에 따라 달라집니다.
timewindow = 5;
recordedTables = smoothRecording(recordedTables, timewindow);
5;
recordedTables = smoothRecording(recordedTables, timewindow);시뮬레이션된 truth를 분석하여 비교합니다.
recordedTables = addManeuvers(recordedTables);
minat = 1; % Minimum tangential acceleration, m/s^2
minan = 1; % Minimum normal acceleration, m/s^2
plotManeuvers(f,recordedTables,minat,minan);
![Figure contains an axes object. The axes object with xlabel East [m], ylabel North [m] contains 6 objects of type scatter.](../../examples/fusion/win64/AnalyzeTruthDataAndDefineTargetModelExample_05.png)
summaryTable = summarizeManeuvers(recordedTables,minat,minan)
summaryTable=6×10 table
    Constant Velocity %    Turn %    Speed Change %    Min Speed    Max Speed    Min Climb Rate    Max Climb Rate    Min Tangential Acceleration    Max Tangential Acceleration    Max Normal Acceleration
    ___________________    ______    ______________    _________    _________    ______________    ______________    ___________________________    ___________________________    _______________________

          73.143           26.857             0          285.5        289.8          -0.1386          0.099782                -0.77035                        0.89733                      27.344
          70.482           29.518        4.2169         296.23       305.01          -31.969           0.12531                  -1.411                         1.9341                      36.395
          69.822           21.302         20.71         274.39       457.39        -0.091943           0.13917                 -10.988                        0.89954                       37.77
          52.632           26.901        40.351         245.29       411.86         -0.61134            54.704                 -4.1592                         5.6348                       54.84
          29.697           39.394        60.606         282.73       449.24         -0.12708            272.82                 -8.0657                         5.9692                      64.294
          40.237           35.503        56.213         205.31       426.97          -120.24           0.13243                 -10.655                         7.2804                      64.799
예상대로, 기록된 데이터 분석 결과는 시뮬레이션된 truth 분석 결과와 완벽하게 일치하지 않습니다. 특히, 기록 속도에 잡음이 많기 때문에 접선 가속도 값이 정확하지 않습니다. 하지만 다른 값들은 최소 속도와 최대 속도에 대한 대략적인 수치를 제공하며, 최대 법선 가속도의 대략적인 크기가 7G 회전(turn)이라는 것까지 확인할 수 있습니다.
truth 사양 정의하기
지금까지는 여러 truth 객체의 기록된 데이터를 분석했습니다. 추적 알고리즘을 정의하는 다음 단계는, 하나 이상의 truth 사양을 제공하여 추적 필터와 다중 객체 추적기를 정의할 수 있는 방식으로 이 데이터를 수집하는 것입니다.
모든 타깃을 기반으로 하나의 truth 사양을 지정하려면 summaryTable을 사용하여 속도와 가속도의 범위를 정의합니다.
truthSpec = struct(Speed = [min(summaryTable.("Min Speed")),max(summaryTable.("Max Speed"))], ...
    ClimbRate = [min(summaryTable.("Min Climb Rate")),max(summaryTable.("Max Climb Rate"))], ...
    TangentialAcceleration = [min(summaryTable.("Min Tangential Acceleration")),max(summaryTable.("Max Tangential Acceleration"))], ...
    MaxNormalAcceleration = max(summaryTable.("Max Normal Acceleration")));
disp(truthSpec);
                     Speed: [205.3083 457.3947]
                 ClimbRate: [-120.2439 272.8185]
    TangentialAcceleration: [-10.9879 7.2804]
     MaxNormalAcceleration: 64.7988
이 truth 사양을 기반으로 추적 필터를 정의하는 방법에는 여러 가지가 있습니다. 문제를 단순화하기 위해, 등속도 모델로 구성된 확장 칼만 필터를 사용합니다. 첫 번째 타깃 위치를 사용하고, 일반적인 위치 측정 불확실성을 100미터로 지정합니다.
state = zeros(6,1);
state(1:2:5) = recordedTables{1}.Position(1,:);
cvekf = trackingEKF(@constvel,@cvmeas,state, ...
    StateTransitionJacobianFcn=@constveljac, ...
    MeasurementJacobianFcn=@cvmeasjac, ...
    StateCovariance=100^2*eye(6), ...
    HasAdditiveProcessNoise=false, ...
    ProcessNoise = eye(3), ... % Just define the size for now
    HasAdditiveMeasurementNoise=true, ...
    MeasurementNoise = eye(3));
truth 사양을 사용하여, 이전 단계에서 측정되지 않은 속도와 관련된 미지의 StateCovariance 요소를 정의합니다.
cvekf.StateCovariance(2,2) = truthSpec.Speed(2)^2; % Corresponds to the unknown Vx
cvekf.StateCovariance(4,4) = truthSpec.Speed(2)^2; % Corresponds to the unknown Vy
cvekf.StateCovariance(6,6) = max(abs(truthSpec.ClimbRate)); % % Corresponds to the unknown Vz
disp(cvekf.StateCovariance);
   1.0e+05 *

    0.1000         0         0         0         0         0
         0    2.0921         0         0         0         0
         0         0    0.1000         0         0         0
         0         0         0    2.0921         0         0
         0         0         0         0    0.1000         0
         0         0         0         0         0    0.0027
마찬가지로, 가속도 성분을 사용하여 ProcessNoise를 정의합니다. 최대 가속도는 최악의 경우 ProcessNoise이지만, 더 나은 추정치를 사용할 수 있습니다.
maxTotalAccelerationSquared = max(abs(truthSpec.TangentialAcceleration))^2+truthSpec.MaxNormalAcceleration^2;
cvekf.ProcessNoise = maxTotalAccelerationSquared * eye(3);
disp(cvekf.ProcessNoise);
   1.0e+03 *

    4.3196         0         0
         0    4.3196         0
         0         0    4.3196
요약
이 예제에서는 타깃이 수행하는 기동의 추정값을 얻기 위해 truth 데이터를 분석하는 방법을 배웠습니다. 이 분석의 결과는 올바른 타깃 모션 모델을 정의하고 속도와 가속도의 범위를 제공하는 데 사용할 수 있습니다. 추적 필터 내에서 이러한 값을 사용하면 필터 상태 공분산 초기화와 공정 잡음에 대한 기초가 될 수 있습니다.
참고 문헌
W.D. Blair, G. A. Watson, T. Kirubarajan, Y. Bar-Shalom, "Benchmark for Radar Allocation and Tracking in ECM." Aerospace and Electronic Systems IEEE Trans on, vol. 34. no. 4. 1998.
지원 함수
scenarioToTruth는 시나리오에서 진리표를 기록합니다. 이 함수는 lookupPose 메서드를 구현하는 궤적을 갖는 truth 객체만 기록합니다.
function truthTables = scenarioToTruth(scenario,options)
arguments
    scenario (1,1) trackingScenario
    options.UpdateRate (1,1) double = 100; % Update rate in Hz
    options.IncludeVelocity (1,1) logical = true; % Record velocity
    options.IncludeAcceleration (1,1) logical = false; % Record acceleration
end
startTime = 0;
stopTime = scenario.StopTime;
timestep = 1/options.UpdateRate;
sampleTimes = (startTime:timestep:stopTime);
numTruths = numel(scenario.Platforms);
truthTables = cell(1,numTruths);
includeInOutput = false(1,numTruths);
for i = 1:numTruths
    if ismethod(scenario.Platforms{i}.Trajectory, 'lookupPose')
        includeInOutput(i) = true;
        [pos, ~, vel, acc, ~] = lookupPose(scenario.Platforms{i}.Trajectory, sampleTimes);
        truthTables{i} = table(sampleTimes(:),pos,'VariableNames',["Time","Position"]);
        if options.IncludeVelocity
            truthTables{i} = addvars(truthTables{i}, vel, NewVariableNames = "Velocity");
        end
        if options.IncludeAcceleration
            truthTables{i} = addvars(truthTables{i}, acc, NewVariableNames = "Acceleration");
        end
    end
end
truthTables = truthTables(includeInOutput);
end
addManeuvers는 속도, 접선 가속도, 법선 가속도를 진리표에 추가합니다.
function truthTables = addManeuvers(truthTables)
for i = 1:numel(truthTables)
    vel = velocity(truthTables{i});
    if ~ismember('Speed',truthTables{i}.Properties.VariableNames)
        speed = vecnorm(vel,2,2);
        truthTables{i} = addvars(truthTables{i},speed,NewVariableNames="Speed");
    end
    if ~ismember('ClimbRate',truthTables{i}.Properties.VariableNames)
        climbRate = -vel(:,3); % Remember that the data is North-East-Down, so climb rate is -Vz
        truthTables{i} = addvars(truthTables{i},climbRate,NewVariableNames="ClimbRate");
    end
    [at,an] = acceleration(truthTables{i});
    if ~ismember("TangentialAcceleration",truthTables{i}.Properties.VariableNames)
        truthTables{i} = addvars(truthTables{i},at,NewVariableNames="TangentialAcceleration");
    end
    if ~ismember("NormalAcceleration",truthTables{i}.Properties.VariableNames)
        truthTables{i} = addvars(truthTables{i},an,NewVariableNames="NormalAcceleration");
    end
end
end
velocity는 truth 객체의 속도를 반환합니다.
function vel = velocity(truth)
arguments
    truth table
end

% Check if there is a column by the name Velocity. If no, use position to find velocity
[hasVelocity,velidx] = ismember('Velocity', truth.Properties.VariableNames);

if hasVelocity
    vel = table2array([truth(:,velidx)]);
else
    dt = diff(truth.Time);
    vel = diff(truth.Position,1,1)./dt;
    vel(end+1,:) = vel(end,:); % Make sure number of rows remains same as the table
end
end
acceleration은 truth 객체의 접선 가속 성분과 법선 가속 성분을 반환합니다.
function [at, an] = acceleration(truth)
arguments
    truth table
end

vel = velocity(truth);
vmag = vecnorm(vel,2,2);
dt = diff(truth.Time);
dt(end+1) = 2*dt(end)-dt(end-1);

% Check if there is a column by the name Acceleration. If no, use velocity
% to find the acceleration
[hasAcc,accidx] = ismember('Acceleration', truth.Properties.VariableNames);
if hasAcc
    acc = table2array([truth(:,accidx)]);
else
    dvel = diff(vel,1,1);
    dvel(end+1,:) = 0;
    acc = dvel./dt;
end

% Compute the tangential acceleration as d|v|/dt
dvmag = diff(vmag,1,1);
dvmag(end+1) = dvmag(end);
at = dvmag./dt;

amag = vecnorm(acc,2,2);
an = sqrt(max(amag.^2-at.^2,0));
end
plotManeuvers는 기동을 플로팅합니다.
function plotManeuvers(f,truthTables,minat,minan)
clf(f);
hold on
colors = [0     0.447 0.741;... % Blue for constant velocity
          0.1   0.741 0.1;  ... % Green for increasing speed
          0.741 0.1   0.1;  ... % Red for decreasing speed
          0.929 0.694 0.125];   % Yellow for turning
for i = 1:numel(truthTables)
    increasingSpeed = truthTables{i}.TangentialAcceleration > minat;
    decreasingSpeed = truthTables{i}.TangentialAcceleration < -minat;
    changingDirection = abs(truthTables{i}.NormalAcceleration) > minan;
    color = colors(1,:) .* (~increasingSpeed & ~decreasingSpeed & ~changingDirection) + ...
        colors(2,:) .* increasingSpeed + colors(3,:) .* decreasingSpeed + colors(4,:) .* changingDirection;
    scatter3(truthTables{i}.Position(:,2),truthTables{i}.Position(:,1),-truthTables{i}.Position(:,3),1,color);
end
xlabel('East [m]');
ylabel('North [m]');
zlabel('Altitude [m]');
view(3);
axis equal;
end
summarizeManeuvers는 기동의 요약을 제공합니다.
function summaryTable = summarizeManeuvers(truthTables,minat,minan)
names = ["Constant Velocity %", "Turn %", "Speed Change %", ...
    "Min Speed", "Max Speed", "Min Climb Rate", "Max Climb Rate", ...
    "Min Tangential Acceleration", "Max Tangential Acceleration", "Max Normal Acceleration"];
summaryTable = table('Size', [numel(truthTables),numel(names)], VariableTypes=repmat({'double'},1,numel(names)), VariableNames=names);
for i = 1:numel(truthTables)
    numSteps = size(truthTables{i},1);
    summaryTable.(names(1))(i) = 100*nnz(abs(truthTables{i}.TangentialAcceleration) <= minat & truthTables{i}.NormalAcceleration < minan)/numSteps;
    summaryTable.(names(2))(i) = 100*nnz(truthTables{i}.NormalAcceleration > minan)/numSteps;
    summaryTable.(names(3))(i) = 100*nnz(abs(truthTables{i}.TangentialAcceleration) > minat)/numSteps;
    summaryTable.(names(4))(i) = min(truthTables{i}.Speed);
    summaryTable.(names(5))(i) = max(truthTables{i}.Speed);
    summaryTable.(names(6))(i) = min(truthTables{i}.ClimbRate);
    summaryTable.(names(7))(i) = max(truthTables{i}.ClimbRate);
    summaryTable.(names(8))(i) = min(truthTables{i}.TangentialAcceleration);
    summaryTable.(names(9))(i) = max(truthTables{i}.TangentialAcceleration);
    summaryTable.(names(10))(i) = max(truthTables{i}.NormalAcceleration);
end
end
simulateRecording은 잡음을 추가하고, 업데이트 속도를 낮추고, 일부 측정값을 삭제하여 truth의 기록을 시뮬레이션합니다.
function recordedTruth = simulateRecording(scenario,gps,recordingProbability)
arguments
    scenario (1,1) trackingScenario
    gps (1,1) gpsSensor
    recordingProbability (1,1) double {mustBeNonnegative,mustBeLessThanOrEqual(recordingProbability,1)} = 0.99
end

truthTables = scenarioToTruth(scenario,UpdateRate=gps.SampleRate,includeVelocity=false,IncludeAcceleration=false);
recordedTruth = truthTables;
for i = 1:numel(truthTables)
    release(gps);
    truePosition = [truthTables{i}.Position];
    trueVelocity = velocity(truthTables{i});
    [posLLA,vel] = gps(truePosition,trueVelocity);
    posned = lla2ned(posLLA,[0 0 0],"ellipsoid");
    recordedTruth{i}.Position = posned;
    recordedTruth{i}.Velocity = vel;
    includeInOutput = rand(size(truthTables{i},1),1) < recordingProbability;
    recordedTruth{i} = recordedTruth{i}(includeInOutput,:);
end
end
smoothRecording은 잡음이 있는 기록된 truth 데이터를 평활화합니다. 이는 데이터 정리기 앱에서 내보낸 것이지만, 여러 개의 기록된 진리표가 처리하는 래퍼가 포함되어 있습니다.
function recordedTruth = smoothRecording(recordedTruth, timewindow)
    if isa(recordedTruth,'cell')
        recordedTruth = cellfun(@(t) smoothOneTruth(t,timewindow), recordedTruth, UniformOutput=false);
    else
        recordedTruth = smoothOneTruth(recordedTruth,timewindow);
    end
end

function oneTruth = smoothOneTruth(oneTruth, timewindow)
oneTruth = splitvars(oneTruth,"Position",NewVariableNames=["Position_1","Position_2","Position_3"]);
oneTruth = smoothdata(oneTruth,"gaussian",timewindow);
oneTruth = mergevars(oneTruth,["Position_1","Position_2","Position_3"],...
    NewVariableName = "Position");
if ismember("Velocity",oneTruth.Properties.VariableNames)
    oneTruth = splitvars(oneTruth,"Velocity",NewVariableNames=["Velocity_1","Velocity_2","Velocity_3"]);
    oneTruth = smoothdata(oneTruth,"gaussian",timewindow);
    oneTruth = mergevars(oneTruth,["Velocity_1","Velocity_2","Velocity_3"],...
        NewVariableName = "Velocity");
end
end