Compute Power Measurements of Voltage Signal in Simulink
Compute the power measurements of a noisy sinusoidal signal using a power meter. These measurements include average power, peak power, and peak-to-average power ratio.
Assume the maximum voltage of the signal  to be 100 V. The instantaneous values of a sinusoidal waveform are given by the equation
  , where
  is the instantaneous value, is the maximum voltage of the signal, and
  is the frequency of the signal in Hz.
Open Model
The input signal is a sum of two sine waves with frequencies set to 1 kHz and 10 kHz, respectively. The frame length and the sampling frequency of the generated signal is 512 samples and 44.1 kHz, respectively. Add zero-mean white Gaussian noise that has a variance of 0.001 to the sinusoidal signal. Vary the amplitude of the sine waves.
To measure the power of this signal, use the Power Meter block. The Measurement parameter is set to 'All'. This setting enables the block to measure the average power, peak power, and peak-to-average power ratio. The length of the sliding window in the power meter is set to 16 samples and the reference load is set to 50 ohms. The power is measured in dBm units. Visualize the power measurements using the Time Scope block.

Compute the Power Measurements
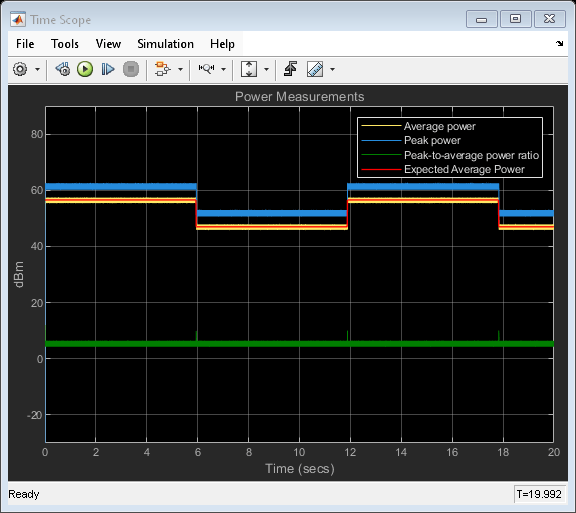
Run the model. The average power, peak power, and peak-to-average power ratio is plotted in the Time Scope window. For details on how the power meter block computes these measurements, see Algorithms.
Compare the measured value to the expected value of the average power.
The expected value of the average power P of the noisy sinusoidal signal is given by the following equation.

where,
 is the amplitude of the first sinusoidal signal.
 is the amplitude of the second sinusoidal signal.
 is the reference load in ohms.
The expected power in dBm is computed using the following equation:

Compare the expected value with the value computed by the object. All values are in dBm. These values match very closely. To verify, view the computed measurements in the Time Scope window.
See Also
Blocks
- Power Meter | Sine Wave | Random Source | Time Scope | MATLAB Function (Simulink) | Pulse Generator (Simulink) | Constant (Simulink) | Switch (Simulink) | Product (Simulink)