Main Content

plotCCDF

Plot CCDF curves

Since R2022a

    Description

    H = plotCCDF(meter) plots CCDF measurements in the powermeter System object™ meter and returns the plot handles as an output H. The number of curves plotted equals the number of input channels.

    H = plotCCDF(meter,ax) plots CCDF measurements using the axes object axis.

    example

    H = plotCCDF(meter,GaussianReference=true), uses the optional name-value argument GaussianReference=true to add a Gaussian reference curve, representing the power of a complex white Gaussian noise calculated as a chi-squared distribution, on the CCDF plot. By default GaussianReference=false.

    H = plotCCDF(___,Name=Value), additionally you can use the name-value arguments of the plot function to customize the configuration of the CCDF plot. For example, plotCCDF(meter,LineWidth=2) plots the CCDF curves with a line width of 2 points.

    Examples

    collapse all

    Compute the average power measurement of the generated voltage signal.

    x = complex(rand(10000,1)-0.5,rand(10000,1)-0.5);
    pm = powermeter(ComputeCCDF=true);
    averagePower = pm(x);                             % power in dB

    Compute the probability that the instantaneous power of the signal is 3 dB above the average power.

    prob = probability(pm,3) % probability in percentage
    prob = 7.6009
    

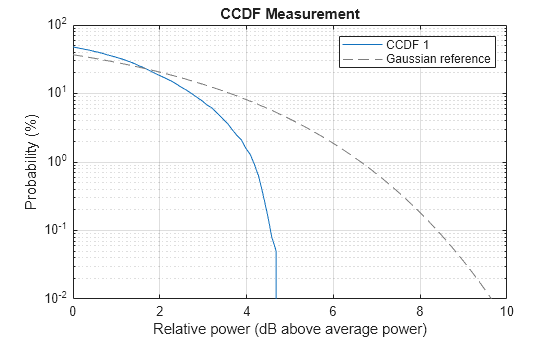
    Plot the CCDF curve.

    plotCCDF(pm,GaussianReference=true)

    Find the relative power for the given probability.

    relativepwr = relativePower(pm,prob)
    relativepwr = 3.0000
    

    Input Arguments

    collapse all

    Power meter, specified as a powermeter System object.

    Target axes, specified as an axes object. If you do not specify the axes, MATLAB plots into the current axes. The x-axis represents the relative power in dB, the ratio of instantaneous signal power to the average signal power. The y-axis represents the probability, in percentage, that the relative power exceeds a specified dB level.

    Output Arguments

    collapse all

    Plot handle output, returned as a line object. For more information about plot handle properties, see Line Properties.

    Version History

    Introduced in R2022a

    See Also

    Objects

    Functions