Time-Domain Responses of MIMO Model
This example shows how to obtain impulse response data and plots for a multi-input, multi-output (MIMO) model using impulse. You can use the same techniques to obtain other types of time-domain responses of MIMO models.
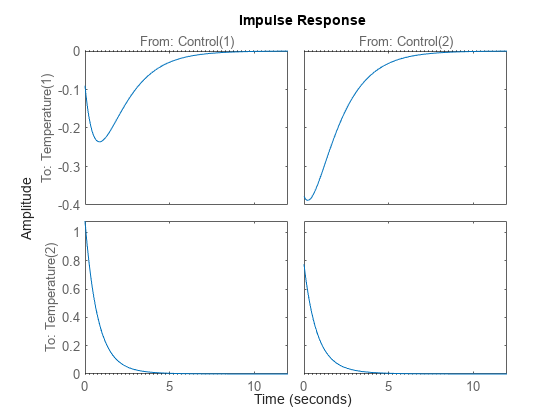
Create a MIMO model and plot its response to a t = 0 impulse at all inputs.
H = rss(2,2,2);
H.InputName = 'Control';
H.OutputName = 'Temperature';
impulse(H)

impulse plots the response of each output to an impulse applied at each input. (Because rss generates a random state-space model, you might see different responses from those pictured.) The first column of plots shows the response of each output to an impulse applied at the first input, Control(1). The second column shows the response of each output to an impulse applied at the second input, Control(2).
Calculate the impulse responses of all channels of H, and examine the size of the output.
[y,t] = impulse(H);
size(y)
ans = 1×3

   162     2     2
The first dimension of the data array y is the number of samples in the time vector t. The impulse command determines this number automatically if you do not supply a time vector. The remaining dimensions of y are the numbers of outputs and inputs in H. Thus, y(:,i,j) is the response at the i th output of H to an impulse applied at the j th input.
See Also
step | initial | stepplot | initialplot | impulse | impulseplot