딥러닝을 사용한 음성 명령 인식
이 예제는 스트리밍 오디오에서 음성 명령 인식을 수행하는 방법을 보여줍니다. 이 예제에서는 사전 훈련된 딥러닝 모델을 사용합니다. 딥러닝 모델이 훈련된 방법을 알아보려면 음성 명령 인식을 위한 딥러닝 신경망 훈련시키기 항목을 참조하십시오.
사전 훈련된 신경망을 불러옵니다. 신경망은 음성 명령(yes, no, up, down, left, right, on, off, stop, go)을 인식하고, 이에 속하지 않는 오디오는 알 수 없는 단어나 배경 잡음으로 분류하도록 훈련되었습니다.
load("SpeechCommandRecognitionNetwork.mat")
labels
labels = 1×12 categorical
down go left no off on right stop up yes unknown background
다음 음성 오디오 신호, 즉 stop이라는 음성, play라는 음성, 그리고 잡음 중에서 하나를 불러옵니다. 단어 stop은 신경망에서 명령으로 인식됩니다. 단어 play는 신경망이 알지 못하는 단어입니다. 신호를 들어봅니다.
audioData = {audioread("stopCommand.flac"),16e3,"stop"};
sound(audioData{1},audioData{2})
{audioread("stopCommand.flac"),16e3,"stop"};
sound(audioData{1},audioData{2})사전 훈련된 신경망은 청각 기반 스펙트로그램을 입력값으로 받습니다. 지원 함수 extractAuditorySpectrogram을 사용하여 스펙트로그램을 추출합니다. 청각 스펙트로그램을 기반으로 오디오를 분류합니다.
auditorySpectrogram = extractAuditorySpectrogram(audioData{1},audioData{2});
score = predict(net,auditorySpectrogram);
prediction = scores2label(score,labels,2);
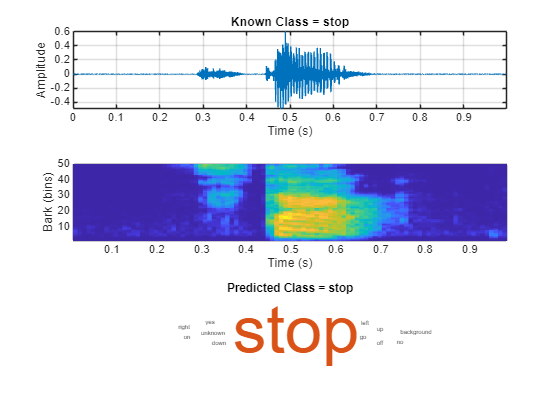
지원 함수 visualizeClassificationPipeline을 사용하여 오디오 신호, 청각 스펙트로그램, 신경망 예측, 예측 점수를 나타내는 워드 클라우드를 플로팅합니다.
visualizeClassificationPipeline(audioData,net,labels)

스트리밍 오디오에서 명령 검출하기
이 모델은 1초 분량의 오디오 데이터에 해당하는 청각 스펙트로그램을 분류하도록 훈련되었습니다. 분류 간 기억의 개념은 없습니다. 이 모델을 스트리밍 응용 분야에 맞게 조정하려면 시간 경과에 따른 결정 신뢰도를 높이는 로직을 추가하면 됩니다.
배경 잡음, 알 수 없는 단어, 알려진 명령이 포함된 9초 길이의 오디오 클립을 만듭니다.
fs = 16e3;
audioPlay = audioread("playCommand.flac");
audioStop = audioread("stopCommand.flac");
audioBackground = 0.02*pinknoise(fs);
audioIn = repmat([audioBackground;audioPlay;audioStop],3,1);
분류 속도를 헤르츠 단위로 지정합니다. 분류 속도는 초당 분류 횟수입니다. 모든 분류에는 1초 분량의 오디오 데이터가 필요합니다.
classificationRate =20; % Hz
결정을 위한 시간 윈도우를 지정합니다. 결정은 결정 시간 윈도우에서 모든 개별 분류를 고려하여 이루어집니다.
decisionTimeWindow =1.5; % seconds
의사 결정 로직에 대한 임계값을 지정합니다. frameAgreementThreshold는 단어를 인식하기 위해 일치해야 하는 decisionTimeWindow 내 프레임의 비율입니다. probabilityThreshold는 decisionTimeWindow의 분류 확률 중 적어도 하나가 넘어야 하는 임계값입니다.
frameAgreementThreshold =50; % percent probabilityThreshold =
0.7;
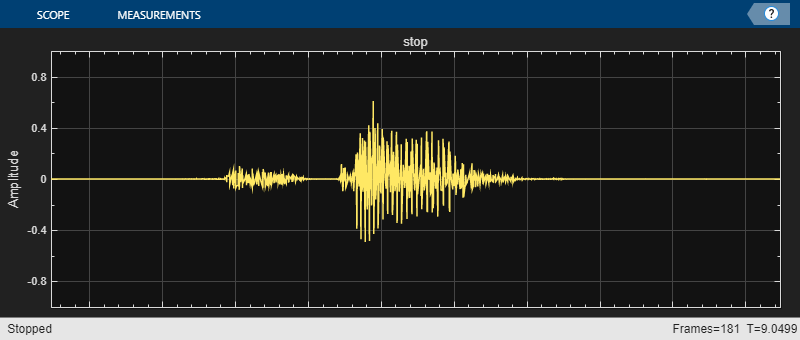
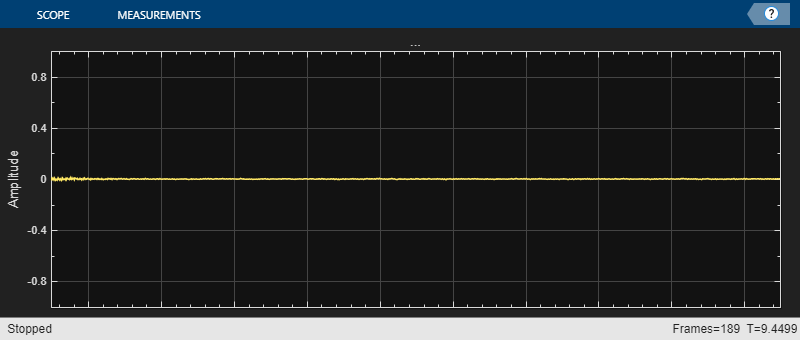
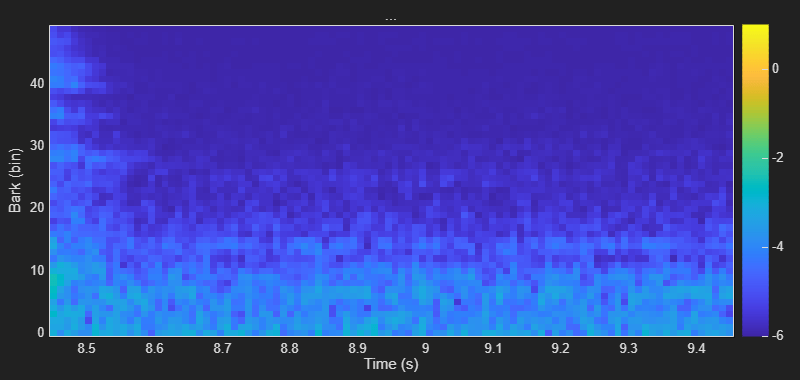
지원 함수 detectCommands를 사용하여 스트리밍 명령 검출을 시뮬레이션합니다. 이 함수는 디폴트 오디오 장치를 사용하여 스트리밍 오디오를 재생합니다.
detectCommands( ...
    Input=audioIn, ...
    SampleRate=fs, ...
    Network=net, ...
    Labels=labels, ...
    ClassificationRate=classificationRate, ...
    DecisionTimeWindow=decisionTimeWindow, ...
    FrameAgreementThreshold=frameAgreementThreshold, ...
    ProbabilityThreshold=probabilityThreshold);


마이크 입력에서 명령 검출하기
마이크에서 입력된 데이터에 대해 음성 명령 인식을 수행하여 모델을 테스트할 수 있습니다. 여기서는 디폴트 오디오 입력 장치에서 오디오를 읽습니다. TimeLimit 파라미터는 오디오 녹음 지속 시간을 제어합니다. 스코프를 닫아 녹음을 조기에 종료할 수 있습니다.
신경망은 음성 명령(yes, no, up, down, left, right, on, off, stop, go)을 인식하고, 이에 속하지 않는 오디오는 알 수 없는 단어나 배경 잡음으로 분류하도록 훈련되었습니다.
detectCommands( ... SampleRate=fs, ... Network=net, ... Labels=labels, ... ClassificationRate=20, ... DecisionTimeWindow=
1.5, ... FrameAgreementThreshold=
50, ... ProbabilityThreshold=
0.7, ... TimeLimit=
10);


지원 함수
청각 스펙트로그램 추출하기
음성 명령 인식을 위한 딥러닝 신경망 훈련시키기에 표시된 대로 오디오 신호에서 Bark 스펙트로그램을 계산합니다. 오디오 입력은 1초 동안 지속되는 모노 오디오 신호여야 합니다.
function features = extractAuditorySpectrogram(x,fs)

% Design audioFeatureExtractor object
persistent afe segmentSamples
if isempty(afe)
    designFs = 16e3;
    segmentDuration = 1;
    frameDuration = 0.025;
    hopDuration = 0.01;

    numBands = 50;
    FFTLength = 512;

    segmentSamples = round(segmentDuration*designFs);
    frameSamples = round(frameDuration*designFs);
    hopSamples = round(hopDuration*designFs);
    overlapSamples = frameSamples - hopSamples;

    afe = audioFeatureExtractor( ...
        SampleRate=designFs, ...
        FFTLength=FFTLength, ...
        Window=hann(frameSamples,"periodic"), ...
        OverlapLength=overlapSamples, ...
        barkSpectrum=true);
    setExtractorParameters(afe,"barkSpectrum",NumBands=numBands,WindowNormalization=false);
end

% Resample to 16 kHz if necessary
if double(fs)~=16e3
    x = cast(resample(double(x),16e3,double(fs)),like=x);
end

% Ensure the input is equal to 1 second of data at 16 kHz.
x = resize(x,segmentSamples,Side="both");

% Extract features
features = extract(afe,x);

% Apply logarithm
features = log10(features + 1e-6);

end
분류 파이프라인 시각화하기
현재 오디오 데이터, 오디오 신호에서 생성된 청각 스펙트로그램, 명령 단어일 가능성이 있는 각각의 단어에 대한 예측 점수의 워드 클라우드를 표시합니다.
function visualizeClassificationPipeline(audioData,net,labels)

% Unpack audio data
audio = audioData{1};
fs = audioData{2};
knownlabel = audioData{3};

% Create tiled layout
tiledlayout(3,1)

% Plot audio signal in first tile
nexttile
plotAudio(audio,fs)
title("Known Class = "+knownlabel)

% Plot auditory spectrogram in second tile
nexttile
auditorySpectrogram = extractAuditorySpectrogram(audio,fs);
plotAuditorySpectrogram(auditorySpectrogram)

% Plot network predictions as word cloud in third tile
nexttile
scores = predict(net,auditorySpectrogram);
prediction = scores2label(scores,labels,2);
wordcloud(labels,scores)
title("Predicted Class = "+string(prediction))

    function plotAuditorySpectrogram(auditorySpectrogram)
        %plotAuditorySpectrogram Plot auditory spectrogram

        % extractAuditorySpectrogram uses 25 ms windows with 10 ms hops.
        % Create a time vector with instants corresponding to the center of
        % the windows
        t = 0.0125:0.01:(1-0.0125);

        bins = 1:size(auditorySpectrogram,2);

        pcolor(t,bins,auditorySpectrogram')
        shading flat
        xlabel("Time (s)")
        ylabel("Bark (bins)")

    end
    function plotAudio(audioIn,fs)
        %plotAudio Plot audio

        t = (0:size(audioIn,1)-1)/fs;
        plot(t,audioIn)
        xlabel("Time (s)")
        ylabel("Amplitude")
        grid on
        axis tight

    end
end
스트리밍 특징 플로팅하기
스트리밍 오디오 입력에 음성 명령 인식 신경망을 적용하고 결과를 시각화합니다. 인수를 조정하여 분류 및 표시 옵션을 사용자 지정합니다.
function detectCommands(options)

arguments
    options.SampleRate
    options.Network
    options.Labels
    options.ClassificationRate
    options.DecisionTimeWindow
    options.FrameAgreementThreshold
    options.ProbabilityThreshold
    options.Input = []
    options.TimeLimit = inf;
end

% Isolate the labels
labels = options.Labels;

if isempty(options.Input)
    % Create an audioDeviceReader to read audio from your microphone.
    adr = audioDeviceReader(SampleRate=options.SampleRate,SamplesPerFrame=floor(options.SampleRate/options.ClassificationRate));

    % Create a dsp.AsyncBuffer to buffer the audio streaming from your
    % microphone into overlapping segments.
    audioBuffer = dsp.AsyncBuffer(options.SampleRate);
else
    % Create a dsp.AsyncBuffer object. Write the audio to the buffer so that
    % you can read from it in a streaming fashion.
    audioBuffer = dsp.AsyncBuffer(size(options.Input,1));
    write(audioBuffer,options.Input);

    % Create an audioDeviceWriter object to write the audio to your default
    % speakers in a streaming loop.
    adw = audioDeviceWriter(SampleRate=options.SampleRate);
end

newSamplesPerUpdate = floor(options.SampleRate/options.ClassificationRate);

% Convert the requested decision time window to the number of analysis frames.
numAnalysisFrame = round((options.DecisionTimeWindow-1)*(options.ClassificationRate) + 1);

% Convert the requested frame agreement threshold in percent to the number of frames that must agree.
countThreshold = round(options.FrameAgreementThreshold/100*numAnalysisFrame);

% Initialize buffers for the classification decisions and scores of the streaming audio.
YBuffer = repmat(categorical("background"),numAnalysisFrame,1);
scoreBuffer = zeros(numel(labels),numAnalysisFrame,"single");

% Create a timescope object to visualize the audio processed in the
% streaming loop. Create a dsp.MatrixViewer object to visualize the
% auditory spectrogram used to make predictions.
wavePlotter = timescope( ...
    SampleRate=options.SampleRate, ...
    Title="...", ...
    TimeSpanSource="property", ...
    TimeSpan=1, ...
    YLimits=[-1,1], ...
    Position=[600,640,800,340], ...
    TimeAxisLabels="none", ...
    AxesScaling="manual");
show(wavePlotter)
specPlotter = dsp.MatrixViewer( ...
    XDataMode="Custom", ...
    AxisOrigin="Lower left corner", ...
    Position=[600,220,800,380], ...
    ShowGrid=false, ...
    Title="...", ...
    XLabel="Time (s)", ...
    YLabel="Bark (bin)");
show(specPlotter)

% Initialize variables for plotting
currentTime = 0;
colorLimits = [-1,1];

% Run the streaming loop.
loopTimer = tic;
while whileCriteria(loopTimer,options.TimeLimit,wavePlotter,specPlotter,options.Input,audioBuffer)

    if isempty(options.Input)
        % Extract audio samples from the audio device and add the samples to
        % the buffer.
        audioIn = adr();
        write(audioBuffer,audioIn);
    end

    % Read samples from the buffer
    y = read(audioBuffer,options.SampleRate,options.SampleRate - newSamplesPerUpdate);

    % Extract an auditory spectrogram from the audio
    spec = extractAuditorySpectrogram(y,options.SampleRate);

    % Classify the current spectrogram, save the label to the label buffer,
    % and save the predicted probabilities to the probability buffer.
    score = predict(options.Network,spec);
    YPredicted = scores2label(score,labels,2);
    YBuffer = [YBuffer(2:end);YPredicted];
    scoreBuffer = [scoreBuffer(:,2:end),score(:)];

    % Plot the current waveform and spectrogram.
    ynew = y(end-newSamplesPerUpdate+1:end);
    wavePlotter(ynew)
    specPlotter(spec')

    % Declare a detection and display it in the figure if the following hold:
    %   1) The most common label is not background.
    %   2) At least countThreshold of the latest frame labels agree.
    %   3) The maximum probability of the predicted label is at least probThreshold.
    % Otherwise, do not declare a detection.
    [YMode,count] = mode(YBuffer);
    maxProb = max(scoreBuffer(labels == YMode,:));
    if YMode == "background" || count < countThreshold || maxProb < options.ProbabilityThreshold
        wavePlotter.Title = "...";
        specPlotter.Title = "...";
    else
        wavePlotter.Title = string(YMode);
        specPlotter.Title = string(YMode);
    end

    % Update variables for plotting
    currentTime = currentTime + newSamplesPerUpdate/options.SampleRate;
    colorLimits = [min([colorLimits(1),min(spec,[],"all")]),max([colorLimits(2),max(spec,[],"all")])];
    specPlotter.CustomXData = [currentTime-1,currentTime];
    specPlotter.ColorLimits = colorLimits;

    if ~isempty(options.Input)
        % Write the new audio to your audio output device.
        adw(ynew);
    end
end
release(wavePlotter)
release(specPlotter)

    function tf = whileCriteria(loopTimer,timeLimit,wavePlotter,specPlotter,Input,audioBuffer)
        if isempty(Input)
            tf = toc(loopTimer)<timeLimit && isVisible(wavePlotter) && isVisible(specPlotter);
        else
            tf = audioBuffer.NumUnreadSamples > 0;
        end
    end
end