CMAPLINE

apply a colormap to lines in a plot

이 제출물을 팔로우합니다

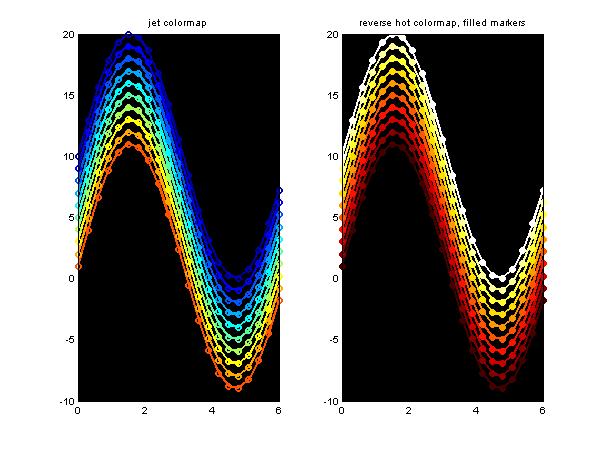
CMAPLINE finds all lines in an axis and specifies their colors according to a colormap. Also accepts custom colormaps in the form of a n x 3 matrix.

EXAMPLE (generates screenshot)

%generate some data
x=(0:0.1:2*pi);
m=50; exdata=bsxfun(@plus,repmat(25.*sin(x),...
[m 1]),[1:m]');

figure
subplot(121);
plot(x,exdata,'o-','linewidth',2)
cmapline('colormap','jet');
set(gca,'color','k')
title('jet colormap')

subplot(122);
plot(x,exdata,'o-','linewidth',2)
custommap=flipud(hot);
cmapline('colormap',custommap,'filled')
set(gca,'color','k')
title('reverse hot colormap, filled markers')

인용 양식

Andrew Stevens (2026). CMAPLINE (https://kr.mathworks.com/matlabcentral/fileexchange/21102-cmapline), MATLAB Central File Exchange. 검색 날짜: .

도움

도움 받은 파일: varycolor

도움 준 파일: COLORMAP and COLORBAR utilities (Jul 2014)

카테고리

Help CenterMATLAB Answers에서 Color and Styling에 대해 자세히 알아보기

일반 정보

MATLAB 릴리스 호환 정보

  • 모든 릴리스와 호환

플랫폼 호환성

  • Windows
  • macOS
  • Linux
버전 퍼블리시됨 릴리스 정보 Action
1.2.0.0

updated help so that the example will run properly, description