


- /
-
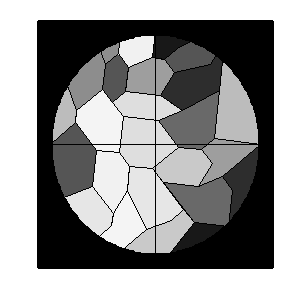
Quartz Through the Microscope
on 25 Nov 2023
- 29
- 229
- 0
- 8
- 1504
drawframe(2);
Write your drawframe function below
function drawframe(f)
% yay geology :D
% looking at quartz through a petrographic microscope!
% when you rotate a thin section (a slice of rock ~35 µm thick, mounted
% on a slide) in cross-polarized light, many minerals change color!
% these color changes are caused by light getting bounced around the
% mineral's crystal lattice; geologists more skilled at optical
% mineralogy than i am can use these color changes, along with a
% variety of other properties, to determine the mineral composition of
% rocks in thin section.
% quartz (SiO2) is one of the easiest and most important sedimentary rock-forming
% minerals to identify through a petrographic microscope; it's perhaps most easily
% distinguished by its extinction from black to whitish to black when you rotate
% the slide 90º.
% learn more:
% http://microckscopic.ro/minerals/silicates/tectosilicates/quartz-thin-section/
% https://www.ucl.ac.uk/~ucfbrxs/MoreMinerals/Quartz.html
% https://www.youtube.com/watch?v=r0RPz0i7Rww
close
th = f*150/48;
rt = [cosd(th) -sind(th); sind(th) cosd(th)];
% i actually drew out the crystals by hand so i could keep track of
% vertices
% they're all hexagons bc that seemed easier
% even rows x, odd rows y; start at top/top right corner and work cw
% xl = crystal btw
xls = [4 5 4 1 0 1; % xl1x
10 9 7 6 7 8; % xl1y
-5 -4 -4 -5 -6 -6; % xl2x
11 10 7 6 8 10; % xl2y
7 8 9 9 5 5; % xl3x
9 6 6 1 1 9; % xl3y
0 2 0 -2 -3 -3; % xl4x
2 0 -2 -2 -1 2; % xl4y
-2 -1 -1 -3 -4 -4; % xl5x
11 10 7 6 7 10; % xl5y
-5 -3 -3 -5 -7 -7; % xl6x
4 2 -1 -1 1 2; % xl6y
-5 -3 -3 -4 -6 -9; % xl7x
-4 -6 -7 -8 -7 -6; % xl7y
3 4 2 -2 0 2; % xl8x
-5 -6 -9 -9 -7 -6; % xl8y
9 6 4 5 4 5; % xl9x
1 -2 -3 -1 0 1; % xl9y
5 5 4 2 0 2; % xl10x
5 1 0 0 2 3; % xl10y
9 10 9 7 7 6; % xl11x
1 -2 -6 -6 -3 -2; % xl11y
1 4 1 0 -1 -1; % xl12x
11 10 8 7 7 10; % xl12y
-7 -5 -5 -9 -9 -9; % xl13x
1 -1 -4 -6 -3 -1; % xl13y
-6 -5 -5 -7 -8 -8; % xl14x
8 6 4 2 4 6; % xl14y
-8 -7 -7 -9 -10 -10; % xl15x
4 2 1 -1 1 2; % xl15y
0 2 0 -3 -4 -3; % xl16x
4 3 2 2 3 4; % xl16y
-3 -2 -2 -3 -5 -5; % xl17x
-1 -2 -4 -6 -4 -1; % xl17y
-2 0 -2 -4 -3 -3; % xl18x
-4 -7 -9 -8 -7 -6; % xl18y
0 3 2 0 -2 -2; % xl19x
-2 -5 -6 -7 -4 -2; % xl19y
4 5 4 1 0 2; % xl20x
0 -1 -3 -3 -2 0; % xl20y
0 1 0 -3 -3 -1; % xl21x
7 6 4 4 6 7; % xl21y
6 7 7 4 1 4; % xl22x
-2 -3 -6 -6 -3 -3; % xl22y
5 5 2 0 1 4; % xl23x
9 5 3 4 6 7; % xl23y
7 6 5 4 2 4; % xl24x
-6 -8 -8 -9 -9 -6; % xl24y
-4 -3 -3 -4 -5 -5; % xl25x
7 6 4 3 4 6]; % xl25y
% now plot
for i = 1:2:max(size(xls))
% rotate
xl = xls(i:i+1,:)'*rt;
color = 0.95*abs(sind(th*2+(i*180/24)))*[1 1 1]+0.01; % changes the color to fit the rotation
patch(xl(:,1), xl(:,2), color, 'LineWidth', 0.25) % the grains kinda do actually have lines in between them irl which is really nice
hold on
end
% this was the easiest way i could figure out how to make a black
% background while leaving the middle clear
% sue me lol
px = zeros(1,14996);
py = zeros(1,14996);
idx = 1;
for i = 0:0.1:10
for j = 0:0.1:10
if i^2 + j^2 > 81
px(idx) = i; py(idx) = j;
px(idx+1) = i; py(idx+1) = -j;
px(idx+2) = -i; py(idx+2) = -j;
px(idx+3) = -i; py(idx+3) = j;
idx = idx+4;
end
end
end
% set up the background
plot(px, py, '.k')
hold on
plot([0 0], [-10 10], '-k', 'LineWidth', 0.1)
hold on
plot([-10 10], [0 0], '-k', 'LineWidth', 0.1)
xticks([]); yticks([]); xlabel([]); ylabel([]);
xlim([-10 10]); ylim([-10 10])
% keep an eye out for calcite through the microscope as soon as i can
% get the animation to run! lol
end

