Help! Projectile Motion Plotting
이전 댓글 표시
clear all
close all
clc
format bank
%---------------------------------------------------------------
h = input('Hight is: ');
v0x = 10;
g = 9.8;
%---------------------------------------------------------------
t_max = sqrt(2*h/g)
x_max = v0x*g
%---------------------------------------------------------------
grid on
axis equal;
xlim([0, 100]);
ylim([0, 100]);
xlabel('x_max)');
ylabel('h');
title ('Graph h, x_max');
I have done most of the code but I dont understand how can I have the same graph look as the photo below (just the ball's motion).
Please help me
댓글 수: 4
Geoff Hayes
2020년 4월 9일
I think that you are missing one or more equations to determine the height at time t and the horizontal displacement at time t. Do you have those?
Dark Shadow
2020년 4월 9일
편집: Dark Shadow
2020년 4월 9일
the cyclist
2020년 4월 9일
편집: the cyclist
2020년 4월 9일
When you say, "that is all I have" you fail to mention this very detailed response you got the previous time you asked very nearly the same question -- just 6 hours ago.
You also asked a different question (also multiple times). And, again, you seem to not be showing any evidence of using any of the information you are receiving.
I think you need to find some help outside of this forum, from your instructor or a tutor.
Dark Shadow
2020년 4월 9일
채택된 답변
Optics Wizard
2020년 4월 9일
1 개 추천
Quick sidenote in response to back-and-forth between OP (Dark Shadow) and the cyclist:
Yes, this question is greater in scope than is altogether appropriate for this message board, and given the previous in-depth response it is reasonable that "the cyclist" thought this post was a bit inappropriate. However, given the difficult quarantine situations impacting several students' education, and that quarantine is driving me insane that I need a bit of a distraction, I don't mind giving an quick physics lesson.
So let's go! Quick physics-coding lesson:
You need to figure out what equations are necessary before you get to coding. For instance:
Yay! We are almost there!
Now what do we know? (this is not for coding, but just to understand the physics process)
Starting height (y-axis): h0 = y0
x-axis velocity: v0x = vx0 = vx (no time dependence!)
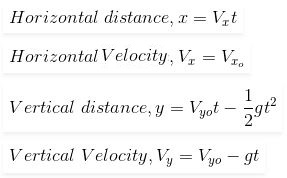
y-axis velocity: vy = -gt (remember, vy0=0 because the projectile is shot horizontally, no vertical component)
The 'y' equation above is actually wrong. It should be y=y0+vyo-(1/2)*(gt^2) (gotta consider the initial condition)
So let's put it together!
y = h0 - (1/2)(gt^2)
What do we want to find? Time t when the object hits the ground: y = 0
0 = h0 - (1/2)(gt^2)
Then solve for t!
t = sqrt(2*h/g) = t_max (that's where the equation you had comes from!)
So what's the max distance?
x = vx*t_max = x_max
Yaaayyy!!!
So, let's plot it. The x_max and t_max equations are good, but they cannot themselves be used to plot the entire path. I'm going to write psuedo-code (not going to test it myself, just to teach the concept) so you'll have to do a bit of the work to implement it, but I'll get you most of the way there.
This is a parametric equation problem: x(t) and y(t)
t = linspace(0,t_max,100); % Set time domain from 0 to t_max
x = vx0*t; % Determine path of object in x
y = h0 - (1/2)(g*t^2); % Determine path of object in y
fprintf('The max distance is: %f \n\n', x_max);
fprintf('The max time is: %f \n\n', t_max);
plot(x,y)
fprintf('We did it! Yaaayyy!!!!);
Hope that helps!
추가 답변 (0개)
카테고리
도움말 센터 및 File Exchange에서 Graphics Performance에 대해 자세히 알아보기
Community Treasure Hunt
Find the treasures in MATLAB Central and discover how the community can help you!
Start Hunting!
Translated by ![]()