How to extract values from a 3-d .mat file?
이전 댓글 표시
Hi,
I loaded a netcdf file and derived a .mat file which is a 3-D matrix of lon x lat x value (360 x 40 x 111). I wanted to extract the third dimension as entire column.
lon=ncread('sstarc.nc','lon');
lat=ncread('sstarc.nc','lat');
summean=ncread('sstarc.nc','sst');
I used the above code and got the mat file. The third dimension has 111 values which I wanted to extract the "111" values for the entire 360 x 40 grid as a column (eg. time series). Attached .mat file!
Looing forward to your help. Thanks!
답변 (1개)
Cris LaPierre
2020년 3월 21일
Your mat file contains variables. Loading the mat file loads the variables back into the workspace.
load summean.mat
If there are multiple variables stored in the mat file, you can tell it to load specific variables instead of all of them.
load summean.mat filteredA
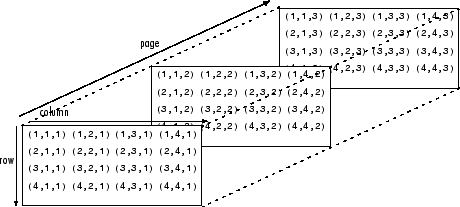
The third dimension does not have 111 values. Instead, you have 111 matrices of dimension 360 x 40 stacked on top of each other. To extract the last one, you could do the following
vals = filteredA(:,:,111);
댓글 수: 9
Keegan Carvalho
2020년 3월 22일
편집: Keegan Carvalho
2020년 3월 22일
Cris LaPierre
2020년 3월 22일
So if I understand, the row and column indices represent lat and lon, and all the values in the matrix are the values for 111 months in the corresponding location. Sound correct?
Your code for doing this is correct, so I suspect your values for lon or lat are not. You are indexing the matrix, so the indices must be postive integer values greater than 0. I suspect at least some of your lon and lat values contain decimal values. Hence, the error message.
So this works: vals=filteredA(60,10,:);
This does not: vals=filteredA(50.5,20.2,:);
If you have lon and lat values, you will want to find a way to map those to the rows and columns of filteredA.
Cris LaPierre
2020년 3월 22일
vals = squeeze(filteredA(60,10,:));
Cris LaPierre
2020년 3월 22일
편집: Cris LaPierre
2020년 3월 22일
The more I read your reply, the more I wonder if you are picturing the data correctly. There are not 111 values in the third dimension. There are 1,598,400. That is, 111 pages of 360x40 values.
If what you want is all 1,598,400 values in a single column vector, that can be done like this:
allVals = filteredA(:);
The result is column-ordered. The first values are the first column on the first page, followed by the second column on the first page, etc until all values on the first page are added. It then adds the values in the first column of the second page, then the second column, etc. This pattern repeats until it gets to the last column on the last page.
Keegan Carvalho
2020년 3월 22일
편집: Keegan Carvalho
2020년 3월 22일
Cris LaPierre
2020년 3월 22일
편집: Cris LaPierre
2020년 3월 22일
Ok, so there are 37 years of data. Each page corresponds to one month (37 x 12 = 444). Here's a quick visualiation of the January 1982 data. So far so good?

Here's the code I used
[LAT, LON] = meshgrid(lat,lon);
sstJan=sst(:,:,1);
geoscatter(LAT(:),LON(:),sstJan(:))
Cris LaPierre
2020년 3월 22일
The variable filteredA contains the data for Jun-Aug for all 37 years (512 x 50 x 111). Now you want this data as a time series. What does that mean to you? Knowing there are now 2,841,600 values, how do you envision this data being organized in a vector? Do you want to preserve location information? Month? Year?
I would be inclined to create a timetable, thus preseving the month and year info. I'd add variables (columns) for sst value, lon and lat.
Following your example above, this is what the code might look like.
% extract data from nc file
lon=ncread('sst.nc','longitude');
lat=ncread('sst.nc','latitude')';
sst=ncread('sst.nc','variable');
% identify summer months
startDate = datetime(1982,1,1,"Format","MMM-uuuu");
endDate = datetime(2018,12,31,"Format","MMM-uuuu");
dates = startDate:calmonths(1):endDate;
summerMonth = month(dates) >= 6 & month(dates) <= 8;
% Set up variables for creating timetable
datesTT = permute(repmat(dates,512,1,50),[1,3,2]); % create a date for each value
datesTT = datesTT(:,:,summerMonth);
[LAT, LON] = meshgrid(lat,lon);
latTT = repmat(LAT,1,1,sum(summerMonth)); % create matrix same size as datesTT
lonTT = repmat(LON,1,1,sum(summerMonth)); % create matrix same size as datesTT
sstSummer = sst(:,:,summerMonth); % Extract data for summer months
% Create timeTable
summerTT = timetable(datesTT(:),sstSummer(:),lonTT(:),latTT(:));
summerTT.Properties.VariableNames = {'sst','lon','lat'};
Here's a preview of what the table looks like (first 8 rows).
Time sst lon lat
________ ______ _______ ______
Jun-1982 271.46 0 89.463
Jun-1982 271.46 0.70313 89.463
Jun-1982 271.46 1.4063 89.463
Jun-1982 271.46 2.1094 89.463
Jun-1982 271.46 2.8125 89.463
Jun-1982 271.46 3.5156 89.463
Jun-1982 271.46 4.2188 89.463
Jun-1982 271.46 4.9219 89.463
Cris LaPierre
2020년 3월 22일
As for taking the mean when there are NaN entries, you can use the following syntax
mean(A,'omitnan')
Keegan Carvalho
2020년 3월 22일
편집: Keegan Carvalho
2020년 3월 22일
카테고리
도움말 센터 및 File Exchange에서 NetCDF에 대해 자세히 알아보기
2020년 3월 20일
2020년 3월 22일
Community Treasure Hunt
Find the treasures in MATLAB Central and discover how the community can help you!
Start Hunting!
Translated by ![]()