How do I plot a new trajectory every time I run through a loop
이전 댓글 표시
close all;
clear;
clc;
%Define Attributes of the ball
m = 0.145; %Mass of the ball(kg)
D = 0.0738; %Diameter of the ball in (m)
A = (pi/4)*D^2; %Cross sectional area of the ball
Cd = 0.35; %Drag coefficient of the ball
%Initial conditions
ti = 0; %Initial time
vi = 49; %Magnitude of Initial velocity in (m/s)
xi = 0; %Initial x position
yi = 0; %Initial y position
g = 9.81; %acceleration of gravity (m/s^2)
%Constants for density function
p0 = 1.22; %Density of the atmosphere in (kg/m^3)
y0 = 8300; %Atmospheric scale height in (m)
%Define timestep and start counter
dt = 0.001;
i = 1;
dtheta = 5;
theta = 30;
for theta = 30:5:60
while ti < 5
%Vector components of velocity
vxi = 49*cosd(theta); %Defines velocity in x direction
vyi = 49*sind(theta); %Defines velocity in y direction
%Define dxdt
dxdt = vxi; %Changes variable for velocity in x direction
dydt = vyi; %Changes variable for velocity in y direction
%Density function dependant on height
py = p0*exp(-yi/y0); %Density as a function of height. It's using what we originally defined the height as before the loop.
%A new height is calculated later and becomes the new initial
%Compute dvxdt and dvydt
dvxdt = ((-0.5*Cd*A.*py)/m).*dxdt.^2; %Defines decceleration by air drag in the x direction
dvydt = (-g - ((0.5*Cd*A.*py)/m).*dydt.^2); %Defines Decceleration by gravity and air drag in the y direction
%Compute vxf and vhf
vxf = vxi + dvxdt*dt; %Defines velocity in the x direction
vyf = vyi + dvydt*dt; %Defines velocity in the y direction
%Compute xf and hf
xf = xi + dxdt*dt - (1/2)*dvxdt*(dt)^2; %Defines Position in the x direction
yf = yi + dydt*dt - (1/2)*dvydt*(dt)^2; %Defines Position in the y direction
%Update time
tf = ti + dt;
%Redefine xi, hi, vxi, vhi, and ti
ti = tf;
vxi = vxf;
vyi = vyf;
xi = xf;
yi = yf;
%Store everything for plotting
T(i) = ti;
X(i) = xi;
Y(i) = yi;
%Update Counter
i = i + 1;
end
end
Ok!
So for my computational physics course, we are tasked with plotting the trajectory of a homerun ball (taking into account the air drag) for different angles. Those angles range from 30 to 60 degrees in increments of 5 degrees.
Basically what I want to do is loop through that entire while loop for 30 degrees, then plot that, then loop through it again at 35 degrees, and then plot that. I want to continue that until 60 degrees. I'd like all of the plots to be on one graph
What I've tried:
I tried an if statement that just said:
hold on;
if theta == 30
plot(X,Y)
elseif theta == 35
plot(X,Y)
elseif theta == 40
plot(x,Y)
%and so on.....
end
This didn't work. I won't lie, I'm not good at coding like at all so I still hardly understand how this stuff works. Any help would be greatly appreciated.
SIDE NOTE: I suspect the physics isn't correct. I'm not asking this community to help with that, buuuuut if you have any insight, that would also be appreciated
채택된 답변
darova
2020년 3월 4일
0 개 추천
I have some helpfull tips
- refresh your initial conditions every time you change angle

- refresh angle of trajectory every iteration

댓글 수: 10
Matthew Orsie
2020년 3월 4일
This is great, but I now have another problem. The end of the previous trajectory connects to the beginning of the next one like so:

Is there a command that basically treats each loop as it's own....thing? Not sure how to word it.
darova
2020년 3월 4일
DId you put this line? (before while loop)
i = 1;
Matthew Orsie
2020년 3월 4일
Matthew Orsie
2020년 3월 4일
darova
2020년 3월 4일
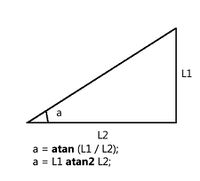
Do you know what that means?
theta = atan2d(vyf,vxf);
Matthew Orsie
2020년 3월 4일
darova
2020년 3월 4일
vf is velocity vector. It shows direction
%Compute vxf and vhf
vxf = vxi + dvxdt*dt; %Defines velocity in the x direction
vyf = vyi + dvydt*dt; %Defines velocity in the y direction
atan2d simply calculate this angle
Try to change dt and see how changes trajectory

darova
2020년 3월 4일

Matthew Orsie
2020년 3월 4일
darova
2020년 3월 4일
추가 답변 (0개)
카테고리
도움말 센터 및 File Exchange에서 MATLAB에 대해 자세히 알아보기
Community Treasure Hunt
Find the treasures in MATLAB Central and discover how the community can help you!
Start Hunting!
Translated by ![]()