Gaussian Peaks in Plotted Data
이전 댓글 표시
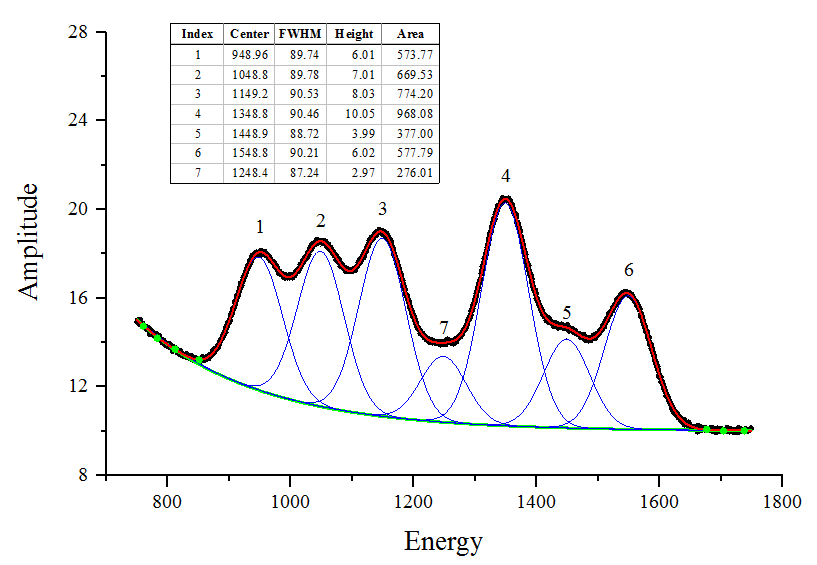
I want to find gaussian peaks in my plotted data and not just the local maxima peaks. 'findpeaks' won't work because it thinks that my x values aren't increasing monotonically. Also, findpeaks is just for the local maxima. I want to fit each peak with a Gaussian curve and transpose it onto my plotted data. Is there a tolbox or command I can use to easily find these peaks? I want to make a graph like the attached.
댓글 수: 1
Thor
2021년 2월 22일
Hi, could I take alook at your code? I got a similar issue
채택된 답변
추가 답변 (0개)
카테고리
도움말 센터 및 File Exchange에서 Descriptive Statistics에 대해 자세히 알아보기
Community Treasure Hunt
Find the treasures in MATLAB Central and discover how the community can help you!
Start Hunting!
Translated by ![]()