Plot Checkboard Pattern with meshgrid?
이전 댓글 표시
Hi, I'm new to matlab and my prof asked us to plot an image like the following: 
We are supposed to used the mesh grid function and modulate it with sin and cos as well as change the contrast to 20%. There's also some specifications for the period of the design. I've come up with the following code but it results in a different image thats more like this :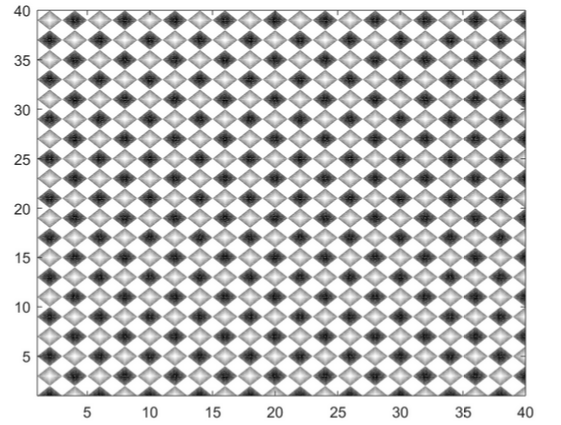 Not sure how to create the one he is asking for. Thanks in advance for your help.
Not sure how to create the one he is asking for. Thanks in advance for your help.[X,Y] = meshgrid(1:40,1:40)
Z = sin(0.5*pi*Y).*cos(0.5*pi*X)
contour(X,Y,Z,20)
colormap(gray)
댓글 수: 2
KALYAN ACHARJYA
2019년 6월 4일
Ok @Raymond Got it
Geoff Hayes
2019년 6월 4일
편집: Geoff Hayes
2019년 6월 4일
Raymond - try increasing the number of coordinates used in the meshgrid.
coords = linspace(1,40,500);
[X,Y] = meshgrid(coords, coords);
Experiment with other values to see the change to the checkerboard.
답변 (0개)
카테고리
도움말 센터 및 File Exchange에서 Graphics Performance에 대해 자세히 알아보기
2019년 6월 4일
2019년 6월 4일
Community Treasure Hunt
Find the treasures in MATLAB Central and discover how the community can help you!
Start Hunting!
Translated by ![]()