3D plot from imported Excel data

조회 수: 114 (최근 30일)
Allison
Allison 2011년 1월 21일
I have data in an Excel file with # columns. I would like to import the first three columns into Matlab and create a 3D mesh of this data however, I am getting an error. Below is what I have tried. Is there a different method I should use?
Test = xlsread('test.xls', 'A19283:C19300') ; %I tested the code by importing a small section of the data from my excel file named 'test'.
x=test(:,1); % x contains the 1st column of ‘test’
y=test(:,2); % y contains the 2nd column of ‘test’
[X Y]=meshgrid(x,y);
Z=test(:,3:size(test,2));
mesh(X,Y,Z)
I get: “Error using ==> mesh at 80 Z must be a matrix, not a scalar or vector.”

채택된 답변

Allison
Allison 2011년 1월 29일
Below is what I have done thus far.I am using the trisurf function but this connects the data points as lines, but I want each data point to be plotted separately. Any suggestions? I don't think I can use the command above about "foo" because it requires there to be a relationship between z and x and y but my data is completely random. For some background, the data I have is from a fatigue test on a material that is being pulled in the y-direction but there is some deformation in the x and z directions as well and the data I want to plot are teh x,y,z locations of the material.
function plot3Ddata(x,y,z)
test = xlsread('test.xls', 'A1:C216825');
x=test(:,1);
y=test(:,2);
z=test(:,3);
tri = delaunay(x,y);
trisurf(tri,x,y,z);
end
  댓글 수: 2
Kenneth Eaton
Kenneth Eaton 2011년 2월 1일
Are you looking for something like the function SCATTER3 (http://www.mathworks.com/help/techdoc/ref/scatter3.html)?
Allison
Allison 2011년 2월 3일
yes, that works! Thank you for your help.

댓글을 달려면 로그인하십시오.

추가 답변 (3개)

Kenneth Eaton
Kenneth Eaton 2011년 1월 21일

Your variable Z is still a column vector, since size(test,2) is 3 and thus the column index 3:size(test,2) is still just 3. You're replicating the vectors x and y to create a set of matrices X and Y when you use MESHGRID, and since z is still a vector, and not a matrix of the same size as X and Y, you can't plot a mesh.

This is a guess, but it sounds like what you actually have is a set of x, y, and z data that represent 3-D points scattered in space that lie on a surface. To plot this surface as a mesh, you have to define some sort of connectivity between them. There are a couple ways to do this:

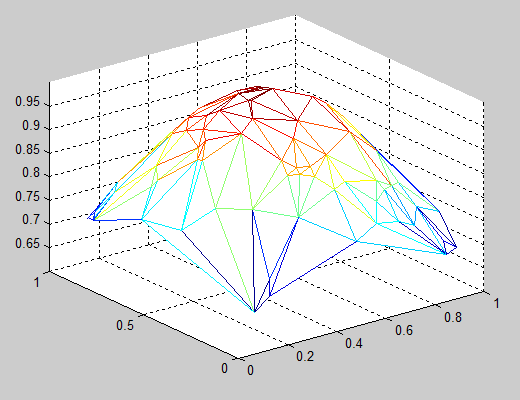
  • Plot a triangular mesh: You can connect your x and y points into a 2-D triangular mesh using the function DELAUNAY, then plot a 3-D mesh using the function TRIMESH:
   x = rand(100,1);                  % Sample x data
   y = rand(100,1);                  % Sample y data
   z = exp(-(x-0.5).^2-(y-0.5).^2);  % Sample z data (a 2-D Gaussian)
   tri = delaunay(x,y);              % Create a 2-D triangular mesh
   trimesh(tri,x,y,z);               % Plot the mesh in 3-D
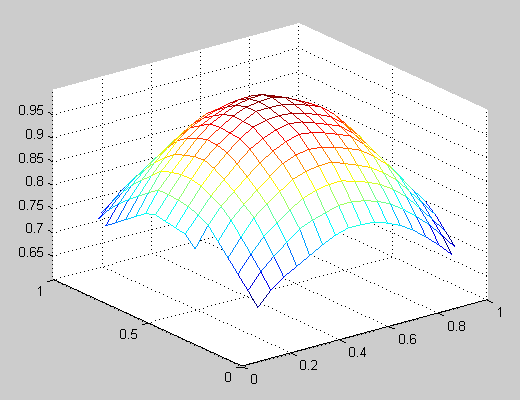
  • Interpolate a regular mesh for your scattered points: You can use the TriScatteredInterp function to create an interpolant that you can evaluate at a given set of regularly spaced grid points, then plot the interpolated 3-D surface using the function MESH. Using the data from the example above:
   [X,Y] = meshgrid(linspace(0,1,20));  % Create a regular grid
   F = TriScatteredInterp(x,y,z);       % Create an interpolant
   Z = F(X,Y);   % Evaluate the interpolant at the grid points
   mesh(X,Y,Z);  % Plot the interpolated mesh

Walter Roberson
Walter Roberson 2011년 1월 21일
As you are importing 3 columns and you are asking for Z to be from column 3 to the last column imported, your Z is going to be a vector.
What you really have is [x,y,z] triples, not a matrix of Z values such as are needed for mesh().
You could do delaunay triangulation and construct the mesh from only the points that you actually have values for. Alternately, you could use griddata() to extrapolate from the known triples to a gridded surface. If you are considering griddata() please also consider the Matlab File Exchange contribution gridfit()

Richard Willey
Richard Willey 2011년 1월 21일
Curve Fitting Toolbox supports command line functions and interactive tools for surface fitting.
The toolbox assumes that surface fitting data is organized as three equally length vectors.
You can generate a surface fit using the sftool interactive tool. Alternatively, you can use the fit command.
The following command will fit a reference plane that predicts Z = f(X,Y)
foo = fit( [X, Y], Z, 'Poly11');
The toolbox supports a variety of fitting methods including linear and nonlinear regression, interpolation, and smoothing.

카테고리

Help CenterFile Exchange에서 Data Import from MATLAB에 대해 자세히 알아보기

제품

Community Treasure Hunt

Find the treasures in MATLAB Central and discover how the community can help you!

Start Hunting!

Translated by