

Good! What exactly is your question? Do you want to create this plot?
How to determine the minimum point of a plot?
조회 수: 24 (최근 30일)
이전 댓글 표시
Hi,
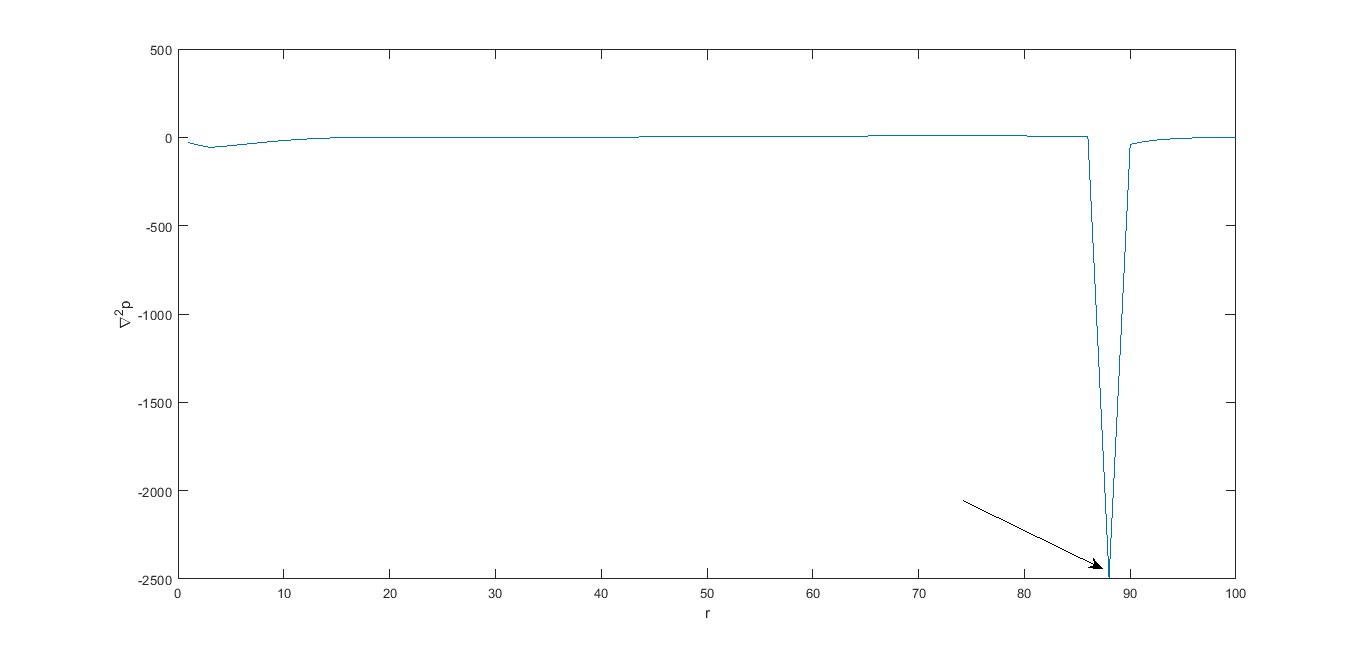
I have a plot as attached herewith in which the value of the point as shown by arrow mark is to be determined and compared to a reference value. It is plotted at a time step of 999 (t ranges from 1 to 1000).
global data;
cp=0;
for i=999:max(length(data.variable.t))
for j=60:max(length(data.variable.x))-1
if data.variable.curvepressure(i,j) <= -10.2661
disp(data.variable.curvepressure(i,j))
cp=1;
break
end
end
end
The above code is not working and need your advice please.
채택된 답변

Piyush Kumar
2024년 7월 30일
편집: Piyush Kumar
2024년 7월 30일
The code you have written will display the values less than or equal to -10.2661. The break you are using will break only from the inner loop. The outer loop continues execution.
From the subject "How to determine the minimum point of a plot?", it seems like you want to find global minima of the plot. However, the provided code does not find the global minimum of the plot.
댓글 수: 0
추가 답변 (1개)

AKennedy
2024년 7월 30일
A function can help you with finding the minimum value of your plot. You can define the function as follows:
Inputs:
- data: The data to be analyzed. This could be a vector, matrix, or structure depending on the data format.
Outputs:
- min_value: The minimum value found in the data.
- min_index: The index of the minimum value in the data.
function [min_value, min_index] = find_plot_minimum(data)
% Assuming data is a vector
if isempty(data)
min_value = NaN;
min_index = NaN;
return;
end
[min_value, min_index] = min(data);
end
You can use this as an outline to find the minimum value from your plot and tweak it to suit your needs.
You can get additional info on the min function here: https://www.mathworks.com/help/matlab/ref/min.html
댓글 수: 8

Walter Roberson
2024년 7월 31일
If it is "uploaded in workspace" then you should be able to just reference it by name.
Not enough input arguments.
You need to pass data to the function.
Variables are passed by reference, not by value, so as long as it is known in the calling workspace, passing it in is fast and cheap.
%calling routine
YourData = .... something appropriate
[Output_min_value, Output_min_index] = find_plot_minimum(YourData)
참고 항목
카테고리
Help Center 및 File Exchange에서 Logical에 대해 자세히 알아보기
Community Treasure Hunt
Find the treasures in MATLAB Central and discover how the community can help you!
Start Hunting!
Translated by 

또한 다음 목록에서 웹사이트를 선택하실 수도 있습니다.
미주
- América Latina (Español)
- Canada (English)
- United States (English)
유럽
- Belgium (English)
- Denmark (English)
- Deutschland (Deutsch)
- España (Español)
- Finland (English)
- France (Français)
- Ireland (English)
- Italia (Italiano)
- Luxembourg (English)
- Netherlands (English)
- Norway (English)
- Österreich (Deutsch)
- Portugal (English)
- Sweden (English)
- Switzerland
- United Kingdom(English)
아시아 태평양
- Australia (English)
- India (English)
- New Zealand (English)
- 中国
- 日本Japanese (日本語)
- 한국Korean (한국어)