Plotting sine functions using linspace command
이전 댓글 표시
Given: 
Find: Create a variable y that calculates the following function for the range of t.
The variable, t, should contain 450 data points, in the interval shown below. You should be using the linspace command for this because you are provided with the number of points in the array.
Don't forget your operators! You are calculating the value of y at each individual element of t.
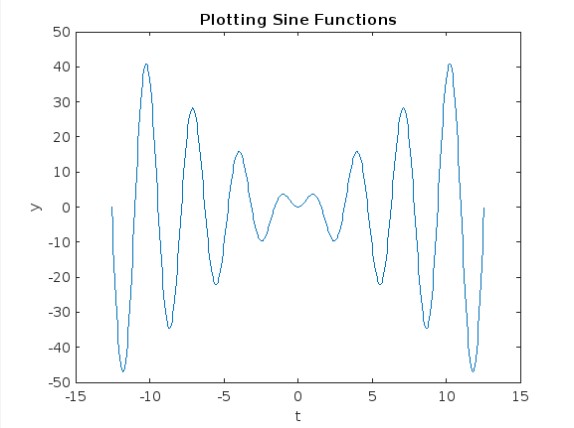
Once you have your t and y vectors filled with values, plot y as a function of t. Remember that, when using the plot function, there should be 2 input arguments: the horizontal coordinates come first and the vertical come second. Try adding the following code to label your plot:
xlabel('t')
ylabel('y')
title('Plotting Sine Functions')
My Solution: I got as far as to state the following:
t = linspace(-4*pi,4*pi,450);
y = 4*t*sin*(2*t);
plot(t,y)
However I was getting an error in my y...
댓글 수: 4
Dyuman Joshi
2024년 2월 25일
What exactly is your question?
Sam Chak
2024년 2월 25일
What do you mean?
Spaceman
2024년 2월 26일
I was having trouble obtaining this plot, due to the error I was getting with my y code line. Operators I believe refer to the element operator .* needed to properly calculate all of the points.
Spaceman
2024년 2월 26일
채택된 답변
% Define the range of t with 450 data points between -4*pi and 4*pi
t = % write the linspace command here
% Calculate y for each t using the given function: y = sin(t)
y = % write the function 'y' command here
% Plotting y as a function of t
plot(t, y)
xlabel('t')
ylabel('y')
title('Plotting Sine Functions')
grid on

MATLAB Learning Material:
References
---------------------------------------------------------------------------------------------------------------------------------------------------
If you find the solution helpful and it resolves your issue, it would be greatly appreciated if you could accept the answer. Also, leaving an upvote and a comment are also wonderful ways to provide feedback.
Professional Interests
- Technical Services and Consulting
- Embedded Systems | Firmware Developement | Simulations
- Electrical and Electronics Engineering
Feel free to contact me.
댓글 수: 5
Dyuman Joshi
2024년 2월 25일
@Hassaan, I've already informed you before to not do obvious homework questions on MATLAB Answers, when no effort has been shown.
You should give hints or push them in the right direction instead of doing just posting a complete solution.
Hassaan
2024년 2월 25일
@Dyuman Joshi Updated!
Spaceman
2024년 2월 26일
Dyuman Joshi
2024년 2월 27일
@Kyle, that is a part of a pre-defined message that I (and many other contributors) use. It's a like an auto-generated message.
I guess you might have just forgot to attach your code. I hope you won't forget it from now onwards.
As there are many homework questions being asked frequently on this forum without any efforts shown, expecting us to solve it for them, we have became a bit strict about this.
We are always happy to help/guide, but we won't do others hw for them.
A suggestion - You could take the free MATLAB Onramp tutorial to learn the essentials and syntax of MATLAB.
Spaceman
2024년 3월 21일
추가 답변 (1개)
It says to plot y as a function of t. You can follow this example to make the plot.
You can learn more about linspace() and plot() in the documentation.
y = @(t) sin(pi*t).*(cos(pi*t)); % create y as a function of t
t = linspace(-pi/2, pi/2, 900); % use linspace to create 900 points over the range -π/2 < t < π/2
plot(t, y(t)), grid on % make the plot

댓글 수: 2
Spaceman
2024년 2월 26일
Sam Chak
2024년 2월 26일
@Kyle Weaver, It's a way of creating an anonymous function. Check out this article:
카테고리
도움말 센터 및 File Exchange에서 Polar Plots에 대해 자세히 알아보기
Translated by ![]()