How can i create these two graphs in matlab , rough idea please
이전 댓글 표시
답변 (1개)
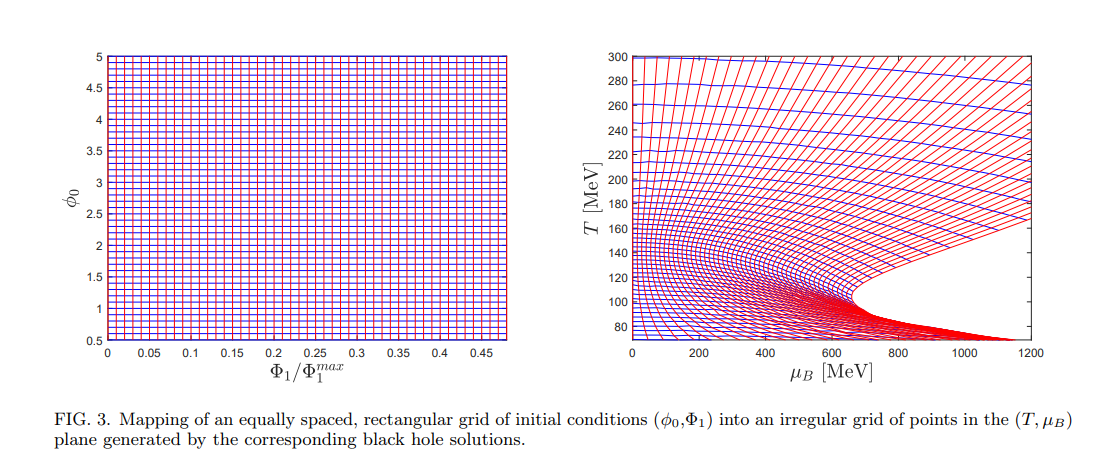
This is only half an answer, but you can reproduce the plot on the left using the following code:
% Define data
x = 0 : 0.01 : 0.48;
y = 0.5 : 0.1 : 5;
% Visualize the data
figure(1)
% Define axes limits
xlim([min(x) max(x)]), xticks(0:0.05:0.45)
ylim([min(y) max(y)]), yticks(0.5:0.5:5)
% Plot red vertical lines and blue horizontal lines
xline(x,'r')
hold on
yline(y,'b')
hold off
% Add labels to the axes
ylabel('\phi_0')
xlabel('{\bf\Phi}_1/{\bf\Phi}_1^{{\itmax}}')

카테고리
도움말 센터 및 File Exchange에서 Annotations에 대해 자세히 알아보기
2024년 2월 24일
Community Treasure Hunt
Find the treasures in MATLAB Central and discover how the community can help you!
Start Hunting!
Translated by ![]()