metrics
Description
[
gets the performance and inter-UAV distance metrics of a UAV formation that you specify as a
trajectory ensemble.performance,distance] = metrics(trajectoryEnsemble)
Examples
Specify the number of UAVs in a UAV formation, and create the timestamps for the UAV trajectories.
% Number of UAVs in the formation
numUAV = 4;

% Timestamps
time = [0; 1];
Specify the position of each UAV in ENU frame in meters at 0 and 1 seconds.
uav1_position = [1 0 10;
                1 0 10.5];
uav2_position = [0.5 0.8 10;
                0.5 1.8 11];
uav3_position = [1.5 1 10;
                1.5 1.8 11];
uav4_position = [2 0 10;
                1.5 0 10.5];
Specify the velocity of each UAV in ENU frame in m/s at 0 and 1 seconds.
uav1_velocity = [0 0 0.5;
                1 0 0];
uav2_velocity = [0 1 1;
                1 0 0];
uav3_velocity = [0 1 1;
                1 0 0];
uav4_velocity = [0 0 0.5;
                1 0 0];
Store the trajectory of each UAV in a timetable, and store the timetables in a cell array.
trajData1=timetable(seconds(time),uav1_position,uav1_velocity,VariableNames={'Position','Velocity'});
trajData2=timetable(seconds(time),uav2_position,uav2_velocity,VariableNames={'Position','Velocity'});
trajData3=timetable(seconds(time),uav3_position,uav3_velocity,VariableNames={'Position','Velocity'});
trajData4=timetable(seconds(time),uav4_position,uav4_velocity,VariableNames={'Position','Velocity'});
Create a UAV trajectory ensemble object. Specify the safety radius as 0.25 meters, a maximum connectivity range of 1.5 meters, and a maximum number of neighbors of 5.
trajectoryEnsemble = uavFormationMetrics({trajData1,trajData2,trajData3,trajData4},SafetyRadius=0.25,ConnectivityRange=1.5,...
    MaxNumNeighbors=5);
Obtain the performance and distance metrics of the UAV formation.
[perfMetrics,distMetrics] = metrics(trajectoryEnsemble);
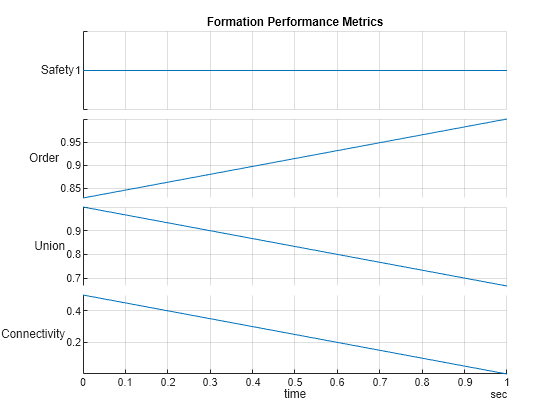
Plot the formation performance metrics.
stackedplot(perfMetrics)
grid on
title("Formation Performance Metrics")
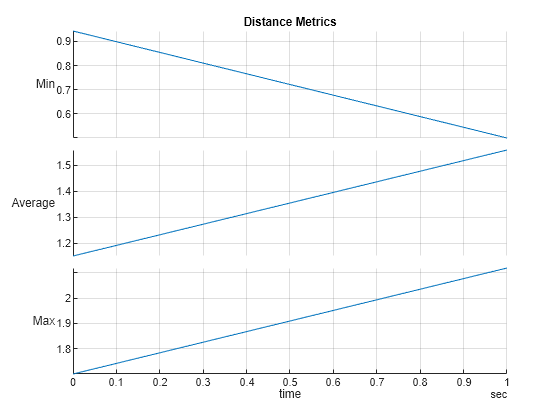
Plot the distance performance metrics.
stackedplot(distMetrics)
grid on
title("Distance Metrics")
Obtain the UAV formation information.
info = formationInfo(trajectoryEnsemble);
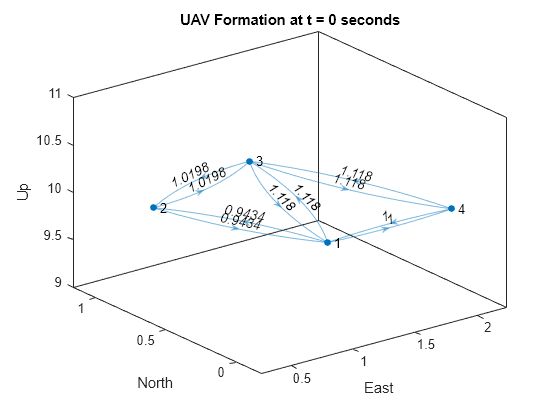
Plot the UAV formation at the initial time step.
% Create edge label for UAV distance at 0 seconds
edgeLabel0 = info.FormationGraph{1}.Edges.Weight;

% Plot the formation at 0 seconds
plot(info.FormationGraph{1},EdgeLabel=edgeLabel0, ...
    XData=info.PositionX(1,:),YData=info.PositionY(1,:), ...
    ZData=info.PositionZ(1,:));

% Add title labels to each axis
title("UAV Formation at t = 0 seconds")
xlabel("East")
ylabel("North")
zlabel("Up")
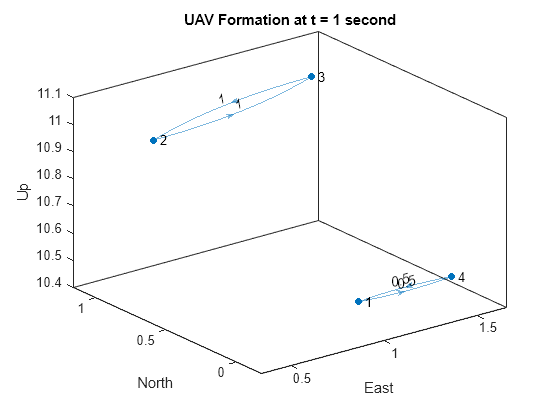
Plot the UAV formation after movement at t = 1 second. In this time, some UAVs are out of the connectivity range and form 2 connected subgroups.
% Create edge label for UAV distance at 1 second
edgeLabel1 = info.FormationGraph{2}.Edges.Weight;

% Plot the formation at 1 second
plot(info.FormationGraph{2},EdgeLabel=edgeLabel1, ...
    XData=info.PositionX(2,:),YData=info.PositionY(1,:), ...
    ZData=info.PositionZ(2,:));

% Add labels to each axis
title("UAV Formation at t = 1 second")
xlabel("East")
ylabel("North")
zlabel("Up")
Obtain the inter-UAV distance for all UAV pairs in the formation at t = 1 second.
info.InterUAVDistance{2}ans=6×2 table
UAVPair Distance
_______ ________
1 2 1.9339
1 3 1.9339
1 4 0.5
2 3 1
2 4 2.119
3 4 1.8682
Input Arguments
Output Arguments
More About
This function uses these metrics [1] to assess the performance of UAV formation.
Safety
Safety measures the risk of collisions between UAVs in the formation, expressed as:
where N is the number of UAVs in the formation, and nag denotes the number of collisions between UAVs in the formation, expressed as:
dij denotes the distance between any pair of UAVs in the formation, and rag denotes the UAV safety radius specified by the
SafetyRadiusproperty ofuavFormationMetricsobject.
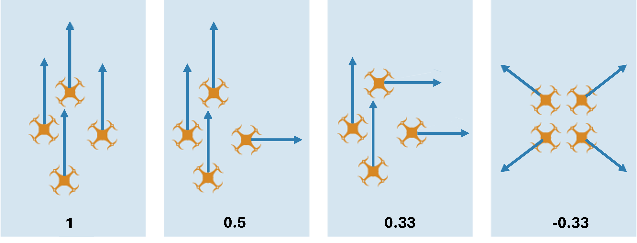
Order
Order measures the correlation of UAV velocities in the formation, expressed as:
Where
The terms in the equation are as follows.
N — The total number of UAV in the formation
Ni — Connected neighbors of UAV i
vi — Velocity vector of UAV i
vj — Velocity vector of jth neighbor of UAV i
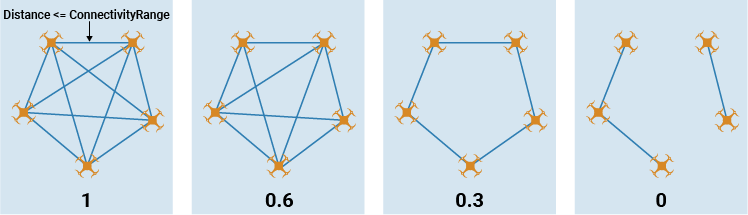
Connectivity
The connectivity metric derives from the algebraic connectivity of the UAV formation graph, expressed as:
where N is the number of UAVs in the formation, and λ2 denotes the second smallest eigenvalue of the Laplacian matrix of the formation graph.
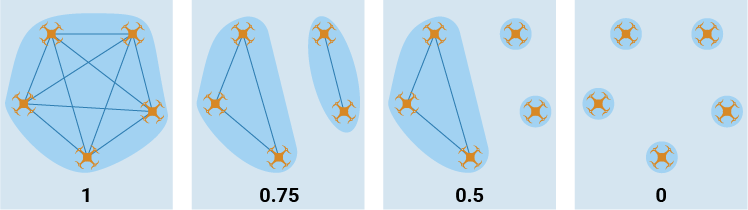
Union
The union metric derives from the number of independent subgroups of the formation, expressed as:
where N is the number of UAVs in the formation, andnc denotes the number of connected UAV subgroups in the formation.
References
[1] Soria, Enrica, Fabrizio Schiano, and Dario Floreano. “The Influence of Limited Visual Sensing on the Reynolds Flocking Algorithm.” In 2019 Third IEEE International Conference on Robotic Computing (IRC), 138–45. Naples, Italy: IEEE, 2019. https://doi.org/10.1109/IRC.2019.00028.
Version History
Introduced in R2024b