formationInfo
Description
info = formationInfo(trajectoryEnsemble)
Examples
Specify the number of UAVs in a UAV formation, and create the timestamps for the UAV trajectories.
% Number of UAVs in the formation
numUAV = 4;

% Timestamps
time = [0; 1];
Specify the position of each UAV in ENU frame in meters at 0 and 1 seconds.
uav1_position = [1 0 10;
                1 0 10.5];
uav2_position = [0.5 0.8 10;
                0.5 1.8 11];
uav3_position = [1.5 1 10;
                1.5 1.8 11];
uav4_position = [2 0 10;
                1.5 0 10.5];
Specify the velocity of each UAV in ENU frame in m/s at 0 and 1 seconds.
uav1_velocity = [0 0 0.5;
                1 0 0];
uav2_velocity = [0 1 1;
                1 0 0];
uav3_velocity = [0 1 1;
                1 0 0];
uav4_velocity = [0 0 0.5;
                1 0 0];
Store the trajectory of each UAV in a timetable, and store the timetables in a cell array.
trajData1=timetable(seconds(time),uav1_position,uav1_velocity,VariableNames={'Position','Velocity'});
trajData2=timetable(seconds(time),uav2_position,uav2_velocity,VariableNames={'Position','Velocity'});
trajData3=timetable(seconds(time),uav3_position,uav3_velocity,VariableNames={'Position','Velocity'});
trajData4=timetable(seconds(time),uav4_position,uav4_velocity,VariableNames={'Position','Velocity'});
Create a UAV trajectory ensemble object. Specify the safety radius as 0.25 meters, a maximum connectivity range of 1.5 meters, and a maximum number of neighbors of 5.
trajectoryEnsemble = uavFormationMetrics({trajData1,trajData2,trajData3,trajData4},SafetyRadius=0.25,ConnectivityRange=1.5,...
    MaxNumNeighbors=5);
Obtain the performance and distance metrics of the UAV formation.
[perfMetrics,distMetrics] = metrics(trajectoryEnsemble);
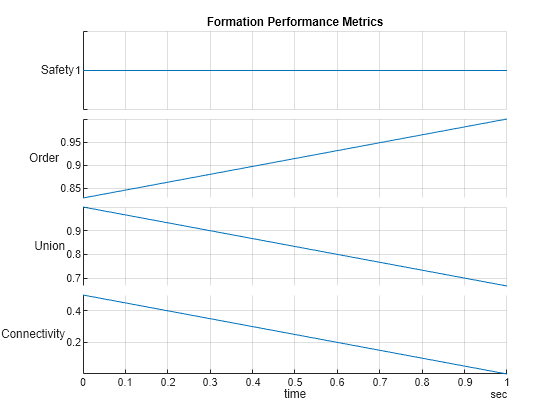
Plot the formation performance metrics.
stackedplot(perfMetrics)
grid on
title("Formation Performance Metrics")
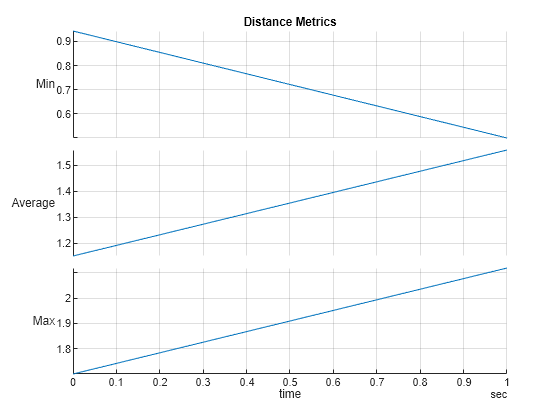
Plot the distance performance metrics.
stackedplot(distMetrics)
grid on
title("Distance Metrics")
Obtain the UAV formation information.
info = formationInfo(trajectoryEnsemble);
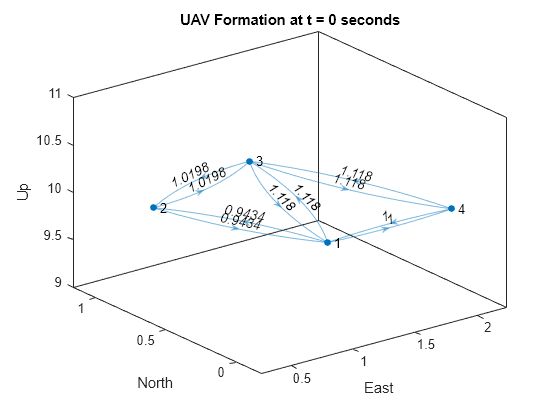
Plot the UAV formation at the initial time step.
% Create edge label for UAV distance at 0 seconds
edgeLabel0 = info.FormationGraph{1}.Edges.Weight;

% Plot the formation at 0 seconds
plot(info.FormationGraph{1},EdgeLabel=edgeLabel0, ...
    XData=info.PositionX(1,:),YData=info.PositionY(1,:), ...
    ZData=info.PositionZ(1,:));

% Add title labels to each axis
title("UAV Formation at t = 0 seconds")
xlabel("East")
ylabel("North")
zlabel("Up")
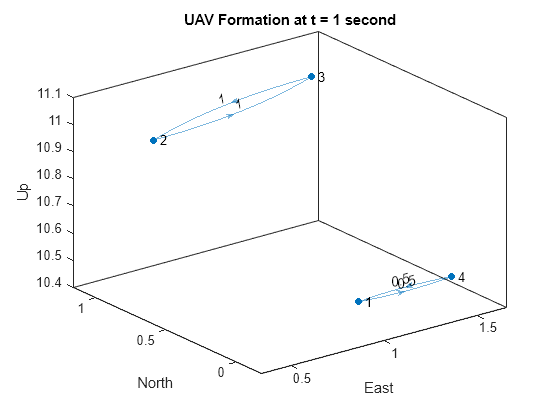
Plot the UAV formation after movement at t = 1 second. In this time, some UAVs are out of the connectivity range and form 2 connected subgroups.
% Create edge label for UAV distance at 1 second
edgeLabel1 = info.FormationGraph{2}.Edges.Weight;

% Plot the formation at 1 second
plot(info.FormationGraph{2},EdgeLabel=edgeLabel1, ...
    XData=info.PositionX(2,:),YData=info.PositionY(1,:), ...
    ZData=info.PositionZ(2,:));

% Add labels to each axis
title("UAV Formation at t = 1 second")
xlabel("East")
ylabel("North")
zlabel("Up")
Obtain the inter-UAV distance for all UAV pairs in the formation at t = 1 second.
info.InterUAVDistance{2}ans=6×2 table
UAVPair Distance
_______ ________
1 2 1.9339
1 3 1.9339
1 4 0.5
2 3 1
2 4 2.119
3 4 1.8682
Input Arguments
Output Arguments
Version History
Introduced in R2024b