show
Description
Examples
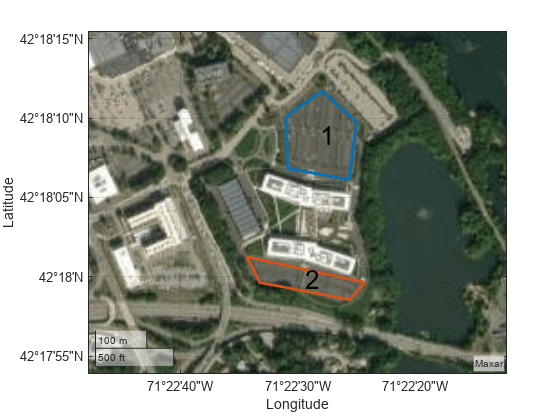
This example shows how to plan a coverage path that surveys the parking lots of the MathWorks Lakeside campus.
Get the geodetic coordinates for the MathWorks Lakeside campus, then create the limits for our map.
mwLS = [42.3013 -71.375 0];
latlim = [mwLS(1)-0.003 mwLS(1)+0.003];
lonlim = [mwLS(2)-0.003 mwLS(2)+0.003];
Create a figure containing the map with the longitude and latitude limits.
fig = figure;
g = geoaxes(fig,Basemap="satellite");
geolimits(latlim,lonlim)
Get the outline of the first parking lot in longitude and latitude coordinates. Then create the polygon by concatenating them.
pl1lat = [42.3028 42.30325 42.3027 42.3017 42.3019]';
pl1lon = [-71.37527 -71.37442 -71.3736 -71.37378 -71.375234]';
pl1Poly = [pl1lat pl1lon];
Repeat the process for the second parking lot.
pl2lat = [42.30035 42.2999 42.2996 42.2999]';
pl2lon = [-71.3762 -71.3734 -71.37376 -71.37589]';
pl2poly = [pl2lat pl2lon];
Create the coverage space with both polygons, and specify these properties:
Waypoints coordinates format: Geodetic
Reference location: MathWorks Lakeside campus location
Reference height: 25 meters
Width of sensor footprint: 20 meters
cs = uavCoverageSpace(Polygons={pl1Poly,pl2poly},UseLocalCoordinates=false,...
    ReferenceLocation=mwLS,ReferenceHeight=25,UnitWidth=20);
Show the coverage space on the map.
show(cs,Parent=g);
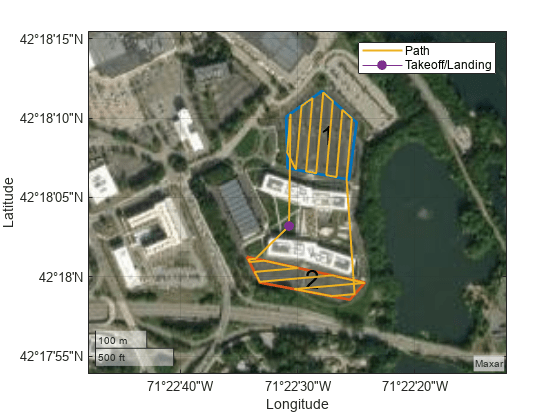
Set the sweep angle for polygons 1 and 2 to 85 and 5 degrees, respectively, to have paths that are parallel to the roads in the parking lots. Then create the coverage planner for that coverage space with the exhaustive solver algorithm.
setCoveragePattern(cs,1,SweepAngle=85)
setCoveragePattern(cs,2,SweepAngle=5)
cp = uavCoveragePlanner(cs,Solver="Exhaustive");
Set the takeoff position to a location in the courtyard, then plan the coverage path.
takeoff = [42.30089 -71.3752, 0];
[wp,soln] = plan(cp,takeoff);
hold on
geoplot(wp(:,1),wp(:,2),LineWidth=1.5);
geoplot(takeoff(1),takeoff(2),MarkerSize=25,Marker=".")
legend("","","Path","Takeoff/Landing")
hold off
Input Arguments
Name-Value Arguments
Output Arguments
Tips
To see the sequence in which the UAV visits the polygons in the coverage path, use the
plan object function
of the uavCoveragePlanner
object, and extract the VisitingSequence field of the solninfo output
argument. For example, [2 1 3] indicates that the UAV visits polygon 2,
polygon 1, and then polygon 3.