plotEffects
Plot main effects of predictors in linear regression model
Description
plotEffects( creates an effects plot
of the predictors in the linear regression model mdl)mdl. An
effects plot shows the estimated main effect on the
response from changing each predictor value, averaging out the effects of the other
predictors. A horizontal line through an effect value indicates the 95% confidence
interval for the effect value.
h = plotEffects(___)h to modify the properties of a specific line after you
create the plot. For a list of properties, see Line Properties.
Examples
Load the carsmall data set and fit a linear regression model of the mileage as a function of model year, weight, and weight squared.
load carsmall
tbl = table(MPG,Weight);
tbl.Year = categorical(Model_Year);
mdl = fitlm(tbl,'MPG ~ Year + Weight^2');
Create an effects plot.
plotEffects(mdl)
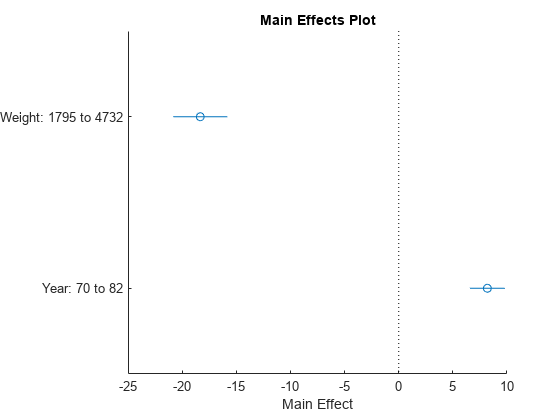
The length of each horizontal line in the figure shows a 95% confidence interval for the effect on the response of the change shown for each predictor. For example, the estimated effect of changing Year from 70 to 82 is an increase of about 8, and is between 6 and 10 with 95% confidence.
Input Arguments
Output Arguments
More About
Tips
The data cursor displays the values of the selected plot point in a data tip (small text box located next to the data point). The data tip includes the x-axis and y-axis values for the selected point. Use the x-axis values to view an estimated effect value and its confidence bounds.
Alternative Functionality
A
LinearModelobject provides multiple plotting functions.When creating a model, use
plotAddedto understand the effect of adding or removing a predictor variable.When verifying a model, use
plotDiagnosticsto find questionable data and to understand the effect of each observation. Also, useplotResidualsto analyze the residuals of the model.After fitting a model, use
plotAdjustedResponse,plotPartialDependence, andplotEffectsto understand the effect of a particular predictor. UseplotInteractionto understand the interaction effect between two predictors. Also, useplotSliceto plot slices through the prediction surface.