Linearize at Simulation Snapshot
This example shows how to use the Model Linearizer app to linearize a model by simulating the model and extracting the state and input levels of the system at specified simulation times.
To linearize your model at the command line, use the linearize function.
Open the Simulink® model.
openExample("watertank")
Open the Model Linearizer for the model.
In the Simulink model window, in the Apps gallery, click Model Linearizer.
To specify linearization input and output points, open the Linearization tab. To do so, in the Apps gallery, click Linearization Manager.
To specify an analysis point for a signal, click the signal in the model. Then, on the Linearization tab, in the Insert Analysis Points gallery, select the type of analysis point.
Configure the output signal of the PID Controller block as an Input Perturbation.
Configure the output signal of the Water-Tank System block as an Open-loop Output.
Create a new simulation-snapshot operating point at which to linearize the model. In the Model Linearizer, in the Operating Point drop-down list, select Take simulation snapshot.
In the Enter snapshot times to linearize dialog box, in the Simulation Snapshot Times field, enter one or more snapshot times at which to linearize. For this example, enter
10to extract the operating point at this simulation time.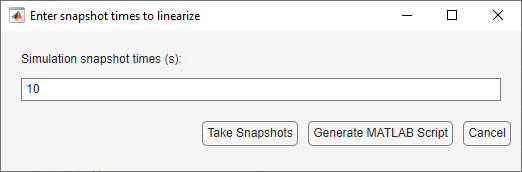
Tip
To linearize the model at several operating points, specify a vector of simulation times in the Simulation Snapshot Times field. For example, entering
[1 10]results in an array of two linear models, one linearized att = 1and the other att = 10.Generate the simulation-snapshot operating point. Click Take Snapshots.
The operating point
op_snapshot1appears in the Linear Analysis Workspace. In the Operating Point drop-down list, this operating point is now selected as the operating point to be used for linearization.Linearize the model at the specified operating point and generate a bode plot of the result.
Click
 Bode. The Bode plot of the linearized plant appears, and the
linearized plant
Bode. The Bode plot of the linearized plant appears, and the
linearized plant linsys1appears in the Linear Analysis Workspace.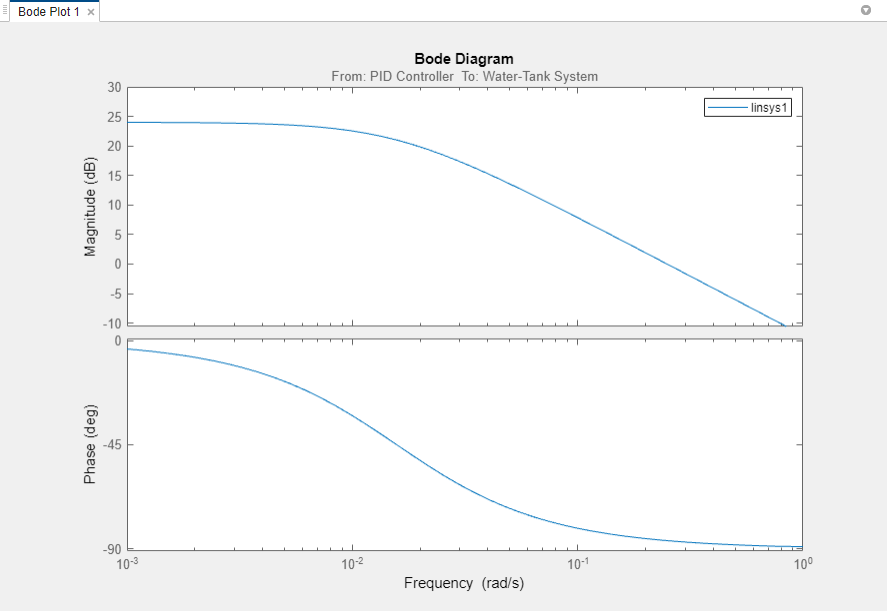
Double-click
linsys1in the Linear Analysis Workspace to see the state space representation of the linear model. Right-click on the plot and select information from the Characteristics menu to examine characteristics of the linearized response.Close Simulink model.
bdclose(sys);