Call a Simulink Function from a Model
You can use a function caller and the function prototype to call and execute your Simulink® function in a model hierarchy. When a function is called, the caller sends data through input arguments to the function, and then receives data back from the function through output arguments. You can call a Simulink function in several ways.
Function Caller block — Call a function defined in Simulink or exported from Stateflow®.
Chart (Stateflow) — Call a function defined in Simulink or exported from Stateflow. For functions that are defined in referenced models, wrap a Function Caller block in a Simulink function inside the chart.
MATLAB Function block — Call a function from a MATLAB® language script.
MATLAB System block — Call a function using a System object™ and the MATLAB language. See Call Simulink Functions from MATLAB System Block.
S-Function block — Call a function using system methods. See
ssDeclareFunctionCallerandssCallSimulinkFunction.SimEvents® Event action – Call a function from an event action of a SimEvents block. See Events and Event Actions (SimEvents).
The following sections show how to call a Simulink function using a Function Caller block, a
Chart block, and a MATLAB Function block. The
function y = timestwo(x) multiplies a value (x)
from a caller by 2, and then sends the calculated value
(y) back to the caller. To define the functions, see Define a Simulink Function in a Model.
Define and Call Simulink Functions
The model named ex_simulink_functions_and_function_callers shows multiple ways to define and call Simulink® functions.
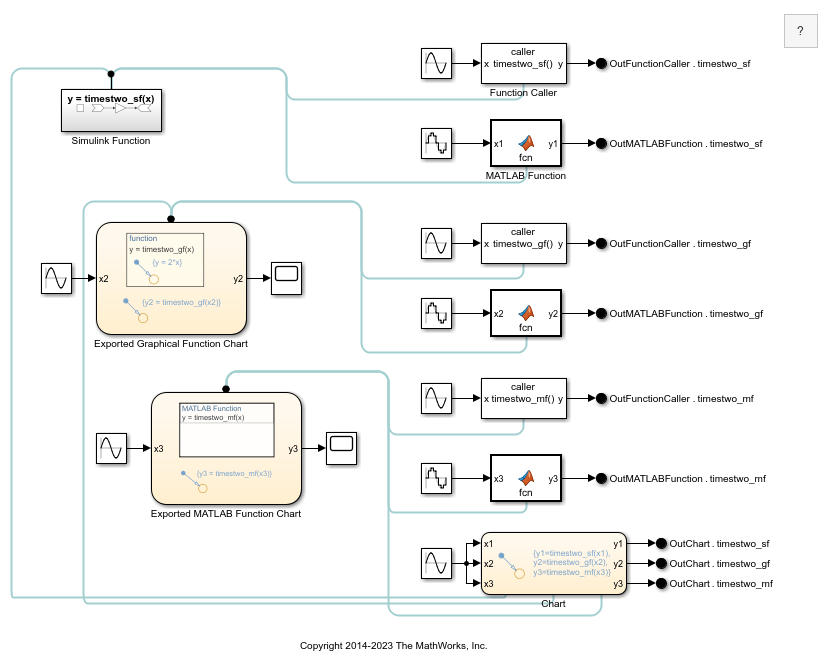
The model defines Simulink functions in the following ways:
Simulink Function block
Stateflow® chart that exports a graphical function
Stateflow chart that exports a MATLAB® function
The model calls each of the Simulink functions in the following ways:
Function Caller block
MATLAB Function block
Stateflow chart
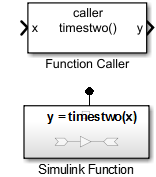
Use Function Caller Block to Call Simulink Function
Set up a Function Caller block to send data through an input argument to a Simulink function, and receive data back from the function through an output argument.
Add a Function Caller block to your model.
Open the Function Caller block parameters. Set the Function prototype parameter to
y = timestwo(x). This function prototype creates an input portxand output portyon the Function Caller block.Note
Typing in a blank text box displays a list of previously created function prototypes that match the text you are typing.
Add and define a Simulink Function block as described in Define Simulink Function Using Simulink Function Block.
Note
The function name and argument names for the Simulink Function block and the Function prototype parameter of the Function Caller block must match exactly.
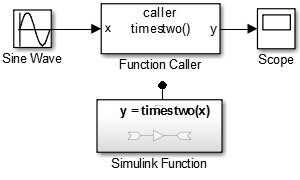
Test the function call
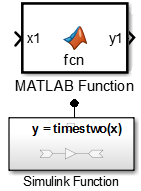
Use MATLAB Function Block to Call Simulink Function
Set up a MATLAB Function block to send data through an input argument to a Simulink function, and receive data back from the function through an output argument.
Add a MATLAB Function block to your model.
Double-click the block to open the MATLAB editor. Enter the function call
y1 =
                                    timestwo(x1)
.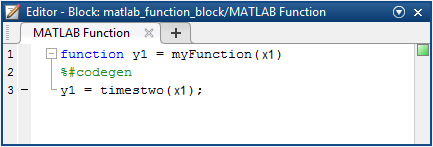
Note
The argument names for the function you define in the MATLAB Function block do not have to match the argument names for the function that you define with a Simulink Function block. For a Function Caller block that calls a Simulink Function block, argument names must match.
Note
MATLAB Function blocks only support discrete and fixed-in-minor sample times.
Add and setup a Simulink Function block as described in Define Simulink Function Using Simulink Function Block.
Test the function call
Add a Sine Wave block to provide test data for the input and a Scope block to view results from the output.
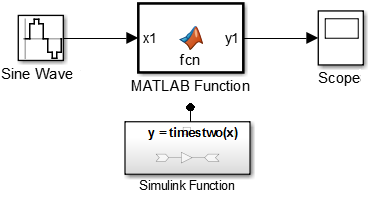
Set these parameters:
Set the Sample time of the Sine Wave block to
0.01.In the Solver pane of the Configuration Parameters, set Type to
Fixed-stepand Fixed-step size to0.01.
Simulate the model.
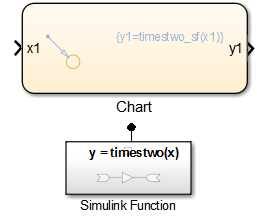
Use Stateflow Chart to Call Simulink Function
Set up a Stateflow chart to send data through an input argument to a Simulink function, and receive data back from the function through an output argument.
For functions that are defined in referenced models, wrap a Function Caller block in a Simulink function inside the chart.
Add a Stateflow chart to your Simulink model.
Open the chart by double-clicking the block.
From the left-side toolbar, click and drag the default transition icon
 onto the chart.
Add an input port to the chart.
Open the Model Explorer.
In the left pane, select
Chart.From the menu, select Add > Data.
Set Name to
x1and Scope toInput.
Note
The argument names for the function you define in the Stateflow chart do not have to match the argument names for the function that you define with a Simulink Function block.
Add an output port to the chart.
From the menu, select Add > Data.
Set Name to
y1and Scope toOutput.
Enter a label for the transition to call a function. For example, to call the Simulink Function block, enter:
{y1=timestwo_sf(x1);}Note
Input signals to a Stateflow chart can be continuous or discrete.
Add and setup a Simulink Function block as described in Define Simulink Function Using Simulink Function Block.
Test the function call
Add a Sine Wave block to provide test data for the input and a Scope block to view results from the output.
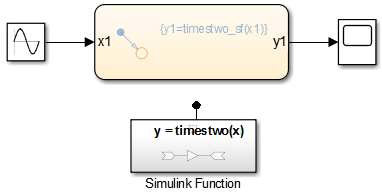
Set these parameters:
Set the Sample time of the Sine Wave block to
0.01.In the Solver pane of the Configuration Parameters, set Type to
Fixed-stepand Fixed-step size to0.01.
Simulate the model.
Call Simulink Function from Multiple Sites
You can call a Simulink function multiple times. If there are multiple calls to a function defined in a Simulink Function block, the state values are persistent between the calls originating from different callers.
For example, suppose you have a Stateflow chart with two calls and two Function Caller blocks
with calls to the same function,
counter.
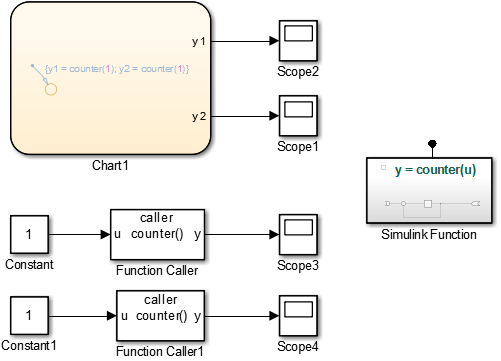
The function named counter is defined in a Simulink
Function block. Each time the counter function is
called, the input argument, u, is incremented by
1.
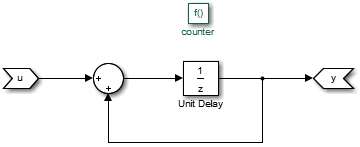
The Unit Delay block has state because the block value is persistent between calls from the two Function Caller blocks and the Stateflow chart. Conceptually, you can think of this function being implemented in MATLAB code:
function y = counter(u)
persistent state;
if isempty(state)
      state = 0;
end
y = state;
state = state + u;
Simulink initializes the state value of the Unit Delay block at the beginning of a simulation. After model initialization, each time the function is called, the state value is updated.
In this example, the output observed in Scope1 increments by
4 at each time step. Scope2,
Scope3, and Scope4 show a similar
behavior. The only difference is a shift in the observed signal due to the
execution sequence of the function calls.
Diagnostic Settings with Multiple Callers
When a function is called by multiple callers that have different sample times, data integrity and consistency of real-time code may be an issue. Consider controlling the severity of diagnostics.
Select a Fixed-step solver. Use the
Treat each discrete rate as a separate task
parameter to specify whether to execute with single task or multitask data
transfer.
For single task data transfer, clear Treat each discrete rate as a separate task, and set the Single task data transfer parameter to
none(default),warning, orerror.For multitask data transfer, select Treat each discrete rate as a separate task, and set the Multitask data transfer parameter to
error(default) orwarning.
See Also
Function Caller | Chart (Stateflow) | MATLAB Function | Simulink Function