Floating Scope and Scope Viewer Tasks
The examples on this page show common Floating Scope and Scope Viewer procedures.
Add Floating Scope Block to Model and Connect Signals
To add a Floating Scope block from the Simulink® block library:
From the Simulation tab, click Library Browser
 .
.From Simulink / Sinks, drag a copy of the Floating Scope block into your model.
To connect signals to your floating scope:
Double-click the Floating Scope block.
In the scope window toolbar, in the Scope pane, click Signal Selector
 .
.The Simulink Editor canvas becomes gray, indicating that you can interactively select signals to connect to the scope.
Select the signals you want to connect to the scope. To select multiple signals, click and drag.
In the Connect dialog box, select the check box next to the signals you want to connect.
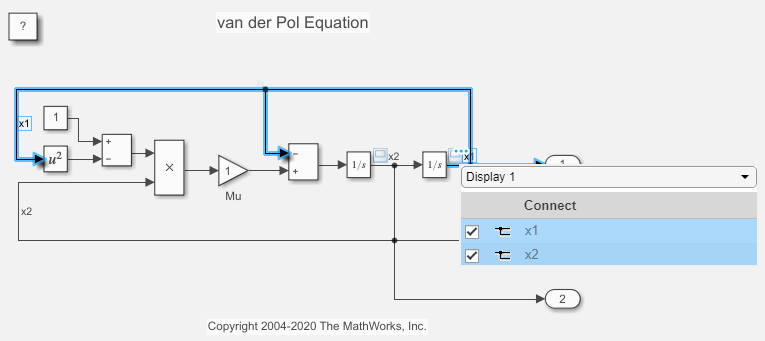
For scopes with multiple displays (subplots), select the desired display from the drop-down list at the top of the Connect dialog box and connect the signals.
Click the X in the upper right of the Simulink canvas.
Your signals are now connected to the floating scope. Run a simulation to see the plotted signals.
Add Scope Viewer to Signal
Select a signal to view.
On the Simulation tab, in the Prepare section, click Add Viewer.
From the Add Viewer window, select a viewer. For example, click Scope.
Add Signals to Existing Floating Scope or Scope Viewer
Connect signals to an existing Floating Scope or Scope viewer.
Open the scope by double-clicking a Floating Scope block or Scope Viewer icon
 .
.In the Scope pane, click Signal Selector
.The Simulink Editor canvas becomes gray, indicating that you can interactively select signals to connect to the scope.
Select the signals you want to connect to the scope. To select multiple signals, click and drag.
In the Connect dialog box, select the check box next to the signals you want to connect.
For scopes with multiple displays (subplots), select the desired display from the drop-down list at the top of the Connect dialog box and connect the signals.
Click the X in the upper right of the Simulink canvas.
Your signals are now connected to the scope. Run a simulation to see the plotted signals.
Save Simulation Data from Floating Scope
This example shows how to save signals to the MATLAB® Workspace using a Floating Scope block. You can follow the same procedure to save data from a Scope Viewer. To save data from a Scope or Time Scope block, see Save Simulation Data Using Scope Block.
This example uses a modified version of the vdp model. In this example, a floating scope is connected to the x1 and x2 signals.
Set Up Signal Logging from the Floating Scope
model = "vdpFloatingScope";
open_system(model);

From the Floating Scope window, select Scope > Settings.
Under Logging, select Log/Unlog Viewed Signals to Workspace. When you click this button, the software places logging symbols on the signals connected to the Floating Scope.
From the Simulink Editor, on the Modeling tab, click Model Settings.
In the Configuration Properties window, select Data Import/Export.
Select Signal logging. You can also set the variable name for the logged data from this window. The default name is
logsout.
Use Saved Simulation Data
Run a simulation.
out = sim(model);

All simulation data logged to the workspace is returned as a single Simulink.SimulationOutput object named out. Logged signals are saved inside the SimulationOutput object as property with the default variable name logsout. To access the data, use dot notation.
out.logsout
ans =

Simulink.SimulationData.Dataset 'logsout' with 2 elements

                         Name  BlockPath
                         ____  ___________________
    1  [1x1 Signal]      x1    vdpFloatingScope/x1
    2  [1x1 Signal]      x2    vdpFloatingScope/x2

  - Use braces { } to access, modify, or add elements using index.
You can also plot the data from the workspace in a MATLAB figure. For example, plot the x1 signal.
x1 = out.logsout{1};
x1_data = x1.Values.Data;
x1_time = x1.Values.Time;
plot(x1_time,x1_data);

Add and Manage Viewers
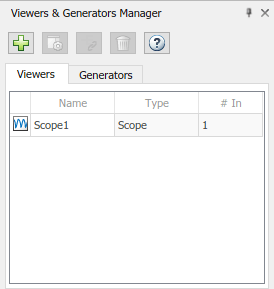
Open the Viewers and Generators Manager. From the Simulink toolstrip, on the Simulation tab, in the Prepare section, select Viewers Manager.
You can see any viewers or generators you add in the Viewers and Generators Manager.
To add viewers or generators, click Add Viewer or Generator
 and choose a viewer. New viewers and
generators are not connected to any signals.
and choose a viewer. New viewers and
generators are not connected to any signals.To connect signals, click a viewer or generator, and click Modify Signal Connections
.To delete a viewer or generator, click Delete Viewer or Generator
 .
.
See Also
Scope | Floating Scope | Scope Viewer