batterySimulationChart
Description
Use batterySimulationChart to construct a dynamic version of the
BatteryChart
object. Use the dynamic version of the battery chart to visualize the time-series data of a
dynamic variable that you store inside a BatterySimulationLog object.
Use this object with a BatterySimulationLog object to visualize how the
relevant states of a specific battery block are impacted by the electro-thermal design and
battery architecture, including cell temperature, current, or state of charge.
The BatterySimulationChart object scales the variable values on a
colormap by using the maximum and minimum values of that variable over the course of the
entire simulation. The software then uses this colormap to update the colors of a
BatteryChart object respecting the battery model resolution and the
location of each cell within the battery design. The software overlays the colormap with a 3-D
battery representation for every cell within that battery at every desired timestep.
If you set the ModelResolution property of the battery to
"Lumped", the colors of all the battery cells in the
visualization are the same. Conversely, if you set the ModelResolution
property of the battery to "Detailed", the colors of each battery
cell in the visualization differ depending on parameters and the dynamic simulation settings,
including different thermal boundary conditions.

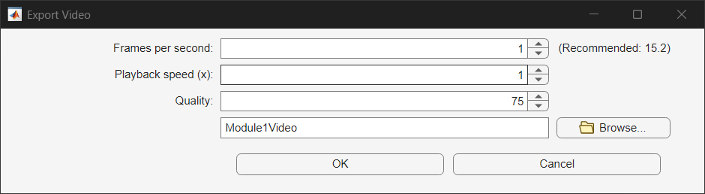
To export the dynamic version of the battery chart as an AVI file, click the Save video button in the container window to open the Export Video window. This window allows you to specify the frames per second, playback speed, and quality of the exported video.
Alternatively, you can use the createVideo
function.
Creation
Syntax
Description
chart = batterySimulationChart(Parent,BatterySimulationLog)BatterySimulationChart object that displays the time-series
data from the BatterySimulationLog property in the container you specify in the Parent property.
chart = batterySimulationChart(BatterySimulationLog)BatterySimulationChart object that displays the time-series
data from the BatterySimulationLog property.
chart = batterySimulationChart(___,Name=Value)
Properties
Container for the visualization of the battery, specified as a
Figure object or a Figure object created using the
uifigure function or one of its child
containers: Tab, Panel, ButtonGroup,
TiledChardLayout, or GridLayout.
Simulation data to visualize on the battery chart, specified as a BatterySimulationLog object.
Current simulation time that the battery chart displays, specified as a positive scalar.
Since R2026a
Number of video frames to capture per second, specified as a positive scalar. The
step size of the playback timer is inversely proportional to the value of this property.
If you set this property to a value greater than the value of the
RecommendedFramesPerSecond property, the rendering of the battery
chart video might occur at a slower rate than real time.
The software updates the battery simulation chart video by using this equation:
(1/FramePerSecond)*PlaybackSpeed
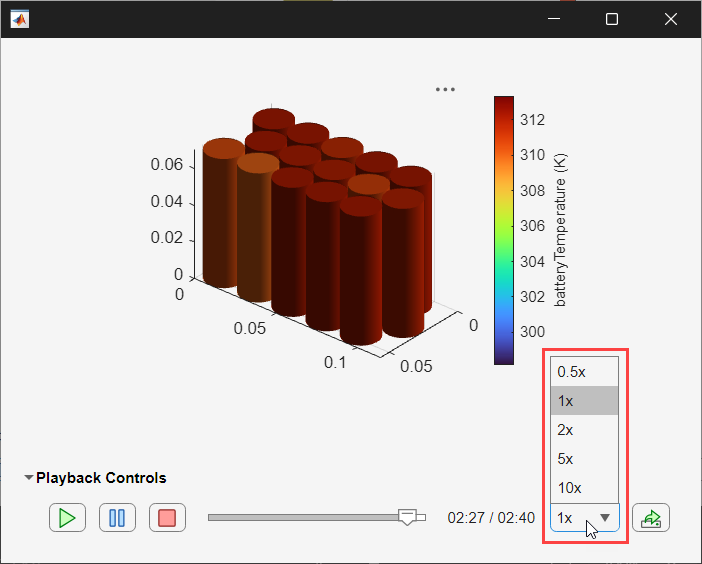
The playback speed is set to 1 by default. To
modify the playback speed, set the PlaybackSpeed name-value
argument or, in the container window of the BatterySimulationChart
object, set the playback speed combo box to the desired speed.
Note
When you set the playback speed to 1, specifying the
FramesPerSecond property in the range [1,
RecommendedFramesPerSecond] enables the
BatterySimulationChart video to play in real time. Increasing the
value of the FramesPerSecond property results in smoother color
transitions for the logged variable in the video. However, the actual playback
performance depends on the complexity of the battery model and the processing power
of your machine. If the computational load is high, the
BatterySimulationChart video might not be able to render at the
intended real-time speed, and playback might appear slower than expected.
Since R2026a
This property is read-only.
Maximum recommended value for the FramesPerSecond property,
returned as a positive scalar. The value of this property is inversely proportional to
the amount of time it takes to conduct one graphics update of the colors for the
BatterySimulationChart object.
Note
The value of the RecommendedFramesPerSecond property is not a
hard limit. You can set the FramesPerSecond property to a value
greater than the value of this property and still get real-time updates. The frequency
of video updates depends on many different factors, including the complexity of your
battery model and the processing power of your machine.
Since R2026a
Video quality, specified as an integer in the range [0,100]. Specifying a higher
value for the Quality property produces videos with higher visual
quality and larger file sizes. Conversely, specifying a lower value for this property
results in videos with reduced visual quality and smaller file sizes.
Since R2026a
Playback speed of the BatterySimulationChart video, specified as
"0.5x","1x","2x","5x",
or "10x".
Option to visualize the axes of the chart, specified as
"on" or "off".
Direction of increasing values along the x-axis, specified as one of these values:
"normal"— Values increase outward from the center of the chart."reverse"— Values decrease outward from the center of the chart.
Direction of increasing values along the y-axis, specified as one of these values:
"normal"— Values increase outward from the center of the chart."reverse"— Values decrease outward from the center of the chart.
Direction of increasing values along the z-axis, specified as one of these values:
"normal"— Values increase outward from the center of the chart."reverse"— Values decrease outward from the center of the chart.
Option to visualize the simulation strategy on the chart, specified as
"on" or "off".
Color of the line for the simulation strategy highlighted on the chart, specified as an RGB triplet, a hexadecimal color code, a color name, or a short name.
For a custom color, specify an RGB triplet or a hexadecimal color code.
An RGB triplet is a three-element row vector whose elements specify the intensities of the red, green, and blue components of the color. The intensities must be in the range
[0,1]; for example,[0.4 0.6 0.7].A hexadecimal color code is a character vector or a string scalar that starts with a hash symbol (
#) followed by three or six hexadecimal digits, which can range from0toF. The values are not case sensitive. Thus, the color codes'#FF8800','#ff8800','#F80', and'#f80'are equivalent.
Alternatively, you can specify some common colors by name. This table lists the named color options, the equivalent RGB triplets, and hexadecimal color codes.
| Color Name | Short Name | RGB Triplet | Hexadecimal Color Code | Appearance |
|---|---|---|---|---|
'red' | 'r' | [1 0 0] | '#FF0000' |
|
'green' | 'g' | [0 1 0] | '#00FF00' |
|
'blue' | 'b' | [0 0 1] | '#0000FF' |
|
'cyan'
| 'c' | [0 1 1] | '#00FFFF' |
|
'magenta' | 'm' | [1 0 1] | '#FF00FF' |
|
'yellow' | 'y' | [1 1 0] | '#FFFF00' |
|
'black' | 'k' | [0 0 0] | '#000000' |
|
'white' | 'w' | [1 1 1] | '#FFFFFF' |
|
'none' | Not applicable | Not applicable | Not applicable | No color |
Here are the RGB triplets and hexadecimal color codes for the default colors.
| RGB Triplet | Hexadecimal Color Code | Appearance |
|---|---|---|
[0 0.4470 0.7410] | '#0072BD' |
|
[0.8500 0.3250 0.0980] | '#D95319' |
|
[0.9290 0.6940 0.1250] | '#EDB120' |
|
[0.4940 0.1840 0.5560] | '#7E2F8E' |
|
[0.4660 0.6740 0.1880] | '#77AC30' |
|
[0.3010 0.7450 0.9330] | '#4DBEEE' |
|
[0.6350 0.0780 0.1840] | '#A2142F' |
|
Line style for the simulation strategy display, specified as a character vector or string scalar containing symbols.
Example: '--' is a dashed line
| Line Style | Description | Resulting Line |
|---|---|---|
'-' | Solid line |
|
'--' | Dashed line |
|
':' | Dotted line |
|
'-.' | Dash-dotted line |
|
Line width for the simulation strategy display, specified as a positive scalar in points, where one point is 1/72 of an inch.
The line width cannot be thinner than the width of a pixel. If you set the line width to a value that is less than the width of a pixel on your system, the line displays as one pixel wide.
Color of light, specified as an RGB triplet, a hexadecimal color code, a color name,
or a short name. The default RGB triplet of [1 1 1] corresponds to
white.
RGB triplets and hexadecimal color codes are useful for specifying custom colors.
An RGB triplet is a three-element row vector whose elements specify the intensities of the red, green, and blue components of the color. The intensities must be in the range
[0,1]; for example,[0.4 0.6 0.7].A hexadecimal color code is a character vector or a string scalar that starts with a hash symbol (
#) followed by three or six hexadecimal digits, which can range from0toF. The values are not case sensitive. Thus, the color codes'#FF8800','#ff8800','#F80', and'#f80'are equivalent.
Alternatively, you can specify some common colors by name. This table lists the named color options, the equivalent RGB triplets, and hexadecimal color codes.
| Color Name | Short Name | RGB Triplet | Hexadecimal Color Code | Appearance |
|---|---|---|---|---|
'red' | 'r' | [1 0 0] | '#FF0000' |
|
'green' | 'g' | [0 1 0] | '#00FF00' |
|
'blue' | 'b' | [0 0 1] | '#0000FF' |
|
'cyan'
| 'c' | [0 1 1] | '#00FFFF' |
|
'magenta' | 'm' | [1 0 1] | '#FF00FF' |
|
'yellow' | 'y' | [1 1 0] | '#FFFF00' |
|
'black' | 'k' | [0 0 0] | '#000000' |
|
'white' | 'w' | [1 1 1] | '#FFFFFF' |
|
Here are the RGB triplets and hexadecimal color codes for the default colors.
| RGB Triplet | Hexadecimal Color Code | Appearance |
|---|---|---|
[0 0.4470 0.7410] | '#0072BD' |
|
[0.8500 0.3250 0.0980] | '#D95319' |
|
[0.9290 0.6940 0.1250] | '#EDB120' |
|
[0.4940 0.1840 0.5560] | '#7E2F8E' |
|
[0.4660 0.6740 0.1880] | '#77AC30' |
|
[0.3010 0.7450 0.9330] | '#4DBEEE' |
|
[0.6350 0.0780 0.1840] | '#A2142F' |
|
Example: 'green'
Type of light source, specified as:
'infinite'— Place the light at infinity. Use theLightPositionproperty to specify the direction from which the light shines in parallel rays.'local'— Place the light at the location specified by theLightPositionproperty. The light is a point source that radiates from the location in all directions.
Location of the light source, specified as a three-element vector of the form
[x y z]. Define the vector elements in data units from the axes
origin to the (x, y, z)
coordinate. The actual location of the light depends on the value of the
LightStyle property.
Example: [-40 -4 140]
Visibility of light from light source, specified as 'on' or
'off', or as numeric or logical 1
(true) or 0 (false). A value
of 'on' is equivalent to true, and
'off' is equivalent to false. Thus, you can use
the value of this property as a logical value.
Object Functions
createVideo | Create video of battery simulation chart |
Examples
Create the Simscape Battery block.
cell = batteryCell(batteryCylindricalGeometry);
cell.CellModelOptions.BlockParameters.ThermalModel = "LumpedThermalMass";
pset = batteryParallelAssembly(cell,15,Rows=3);
module = batteryModule(pset, ...
    ModelResolution="Detailed", ...
    AmbientThermalPath="CellBasedThermalResistance");
libraryname = "Batteries";
buildBattery(module,"LibraryName",libraryname);
Create and open the Simulink battery model.
modelname = "batterymodel";
open_system(new_system(modelname));
Name and add the required blocks to the mode.
batteryBlockPath = strcat(modelname,"/","Module1");
electricalRefBlockPath = strcat(modelname,"/","ElectricalReference");
solverConfigBlockPath = strcat(modelname,"/","Solver");
currentSourceBlockPath = strcat(modelname,"/","Current Source");
temperatureSourceBlockPath = strcat(modelname,"/","Temperature Source");

% Add blocks to the model
add_block( strcat(libraryname,"_lib/",module.Name),batteryBlockPath,'position',[150,100,300,250]);
add_block("fl_lib/Electrical/Electrical Elements/Electrical Reference",electricalRefBlockPath,'position',[215,320,235,340],'orientation',"down");
add_block("nesl_utility/Solver Configuration",solverConfigBlockPath,'position',[-80,280,-30,320]);
add_block("fl_lib/Electrical/Electrical Sources/DC Current Source",currentSourceBlockPath,'position',[-30,150,0,200],'orientation',"down",'i0',num2str(-500));
add_block("fl_lib/Thermal/Thermal Sources/Temperature Source",temperatureSourceBlockPath,'position',[80,160,120,200],'orientation',"left");
Connect all blocks by using the simscape.addConnection function.
simscape.addConnection(batteryBlockPath,"n",currentSourceBlockPath,"n");
simscape.addConnection(batteryBlockPath,"p",currentSourceBlockPath,"p");
simscape.addConnection(batteryBlockPath,"AmbH",temperatureSourceBlockPath,"A");
simscape.addConnection(electricalRefBlockPath,"V",solverConfigBlockPath,"port");
simscape.addConnection(batteryBlockPath,"n",electricalRefBlockPath,"V");
Enable the logged simulation data for your model.
set_param(modelname,"SimscapeLogType",'all')
set_param(batteryBlockPath,"AmbientResistance",strcat("[",num2str((60-1).*rand(15,1)' + 1),"]"));
Simulate the model.
out = sim(modelname,'StartTime','0','StopTime','160');
Create a BatterySimulationLog object. Select the variable for
visualization, then display the object.
batterySimLog = batterySimulationLog(module,out.simlog.Module1,SelectedVariable="batteryTemperature");
disp(batterySimLog)
  BatterySimulationLog with properties:

                 Battery: [1×1 simscape.battery.builder.Module]
                  SimLog: [1×1 simscape.logging.Node]
        SelectedVariable: "batteryTemperature"
    SelectedVariableUnit: "K"
          ModelVariables: ["socCell"    "numCycles"    "batteryVoltage"    "batteryTemperature"    "batteryCurrent"]
Visualize the selected variable using the BatterySimulationChart
object.
f = uifigure("Color","w");
g = uigridlayout(f,[1,1]);
moduleChart = batterySimulationChart(g,batterySimLog);
moduleChartColorBar = colorbar(moduleChart);
ylabel(moduleChartColorBar,strcat(batterySimLog.SelectedVariable," (",batterySimLog.SelectedVariableUnit,")"));

Version History
Introduced in R2023bYou can set the playback speed of the BatterySimulationChart video
programmatically by using the PlaybackSpeed name-value argument.
Specify this argument as "0.5x", "1x",
"2x", "5x", or
"10x".
Before R2026a, you can set the playback speed of the video only by using the combo box
in the container window of the BatterySimulationChart object.