colorbar
색조를 표시하는 컬러바(Colorbar)
구문
설명
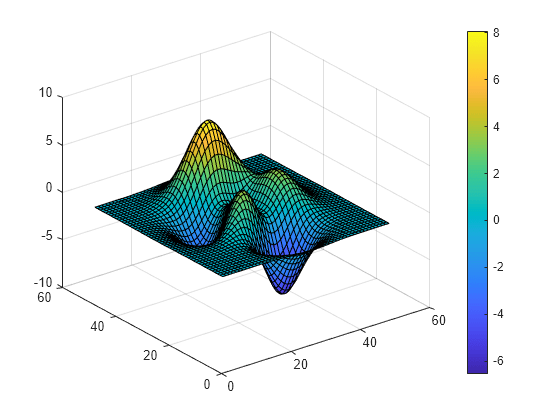
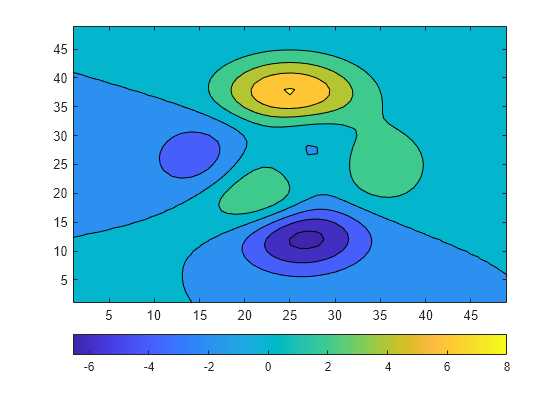
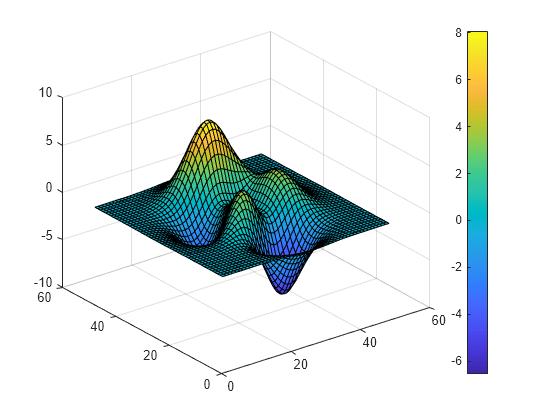
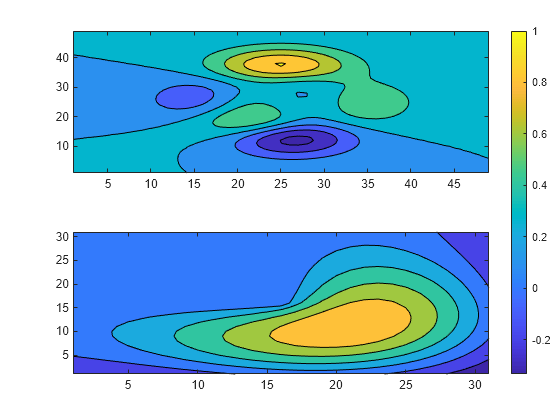
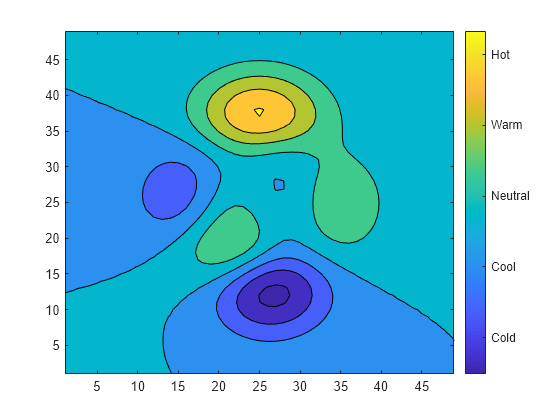
colorbar는 현재 좌표축이나 차트의 오른쪽에 세로 컬러바를 표시합니다. 컬러바는 현재 컬러맵을 표시하고 데이터 값의 컬러맵 매핑을 나타냅니다.
colorbar(___,는 하나 이상의 이름-값 쌍 인수를 사용하여 컬러바 모양을 수정합니다. 예를 들어, Name,Value)'Direction','reverse'는 색조를 반전시킵니다. 위에 열거된 구문에서 Name,Value를 마지막 인수 쌍으로 지정합니다. 컬러바 모양을 수정할 수 없는 차트 유형도 있습니다.
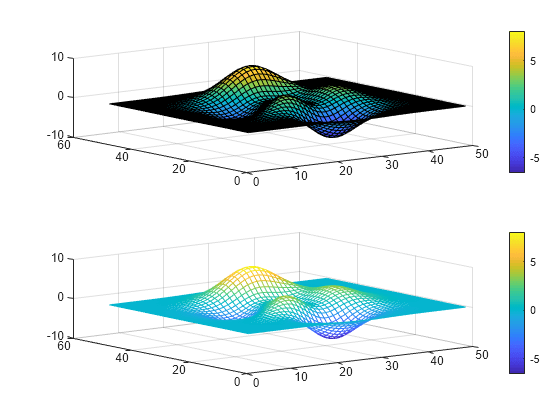
colorbar(은 target,___)target으로 지정된 좌표축 또는 차트에 컬러바를 추가합니다. 위에 열거된 구문에서 대상 좌표축 또는 차트를 첫 번째 인수로 지정합니다.
c = colorbar(___)는 ColorBar 객체를 반환합니다. 컬러바를 만든 후 이 객체를 사용하여 속성을 설정할 수 있습니다. 위에 열거된 구문에 반환 인수 c를 사용할 수 있습니다.
예제
입력 인수
이름-값 인수
팁
컬러바를 따라 텍스트 설명을 추가하려면 컬러바의
Label속성을 사용하여 기본 text 객체에 액세스하십시오.c.Label.String = 'My Colorbar Label';기타 text 속성을 설정하여 글꼴 스타일 또는 색과 같은 레이블 모양을 변경할 수 있습니다. 속성 목록은 Text 속성를 참조하십시오. 예를 들어, 다음 코드는 글꼴 크기를 변경합니다.
c.Label.FontSize = 12;
컬러바를 추가하면 컬러바가 표시되도록 좌표축의 크기가 조정될 수 있습니다.
좌표축이 존재하지 않으면
colorbar함수는 빈 좌표축을 만들고 디폴트 컬러맵을 사용해 컬러바를 표시합니다.colorbar('off')대신colorbar('delete')또는colorbar('hide')를 사용하여 현재 좌표축에 있는 컬러바를 모두 삭제할 수 있습니다. 이러한 명령은 모두 동일합니다.
