extractsigroi
Extract signal regions of interest
Description
Examples
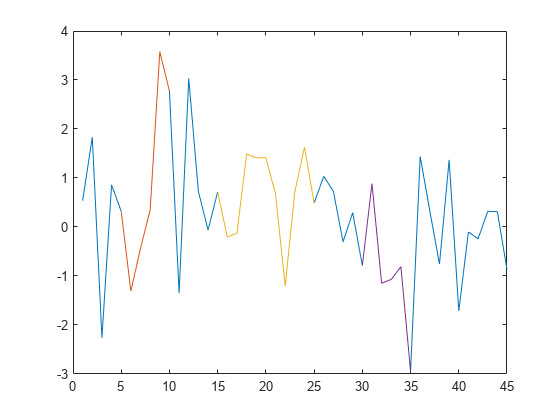
Consider a two-column matrix representing possible regions of interest of a 45-sample random signal. Extract the signal samples corresponding to the regions of interest.
x = randn(45,1);

roilims = [5 10; 15 25; 30 35];

sigroi = extractsigroi(x,roilims);
Plot the signal and highlight the regions of interest.
plot(x)

hold on
for kj = 1:length(sigroi)
    plot(roilims(kj,1):roilims(kj,2),sigroi{kj})
end
hold off
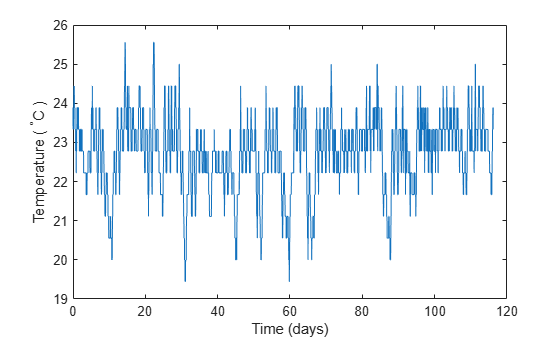
Consider a set of temperature data collected by a thermometer inside an office building for about four months. The device takes a reading every half hour. The sample rate is thus 48 measurements/day. Convert the temperature to degrees Celsius and plot the data.
load officetemp

tempC = (temp-32)*5/9;

fs = 48;
t = (0:length(tempC) - 1)/fs;

plot(t,tempC)
xlabel('Time (days)')
ylabel('Temperature ( {}^\circC )')
Create region-of-interest limits that separate the temperature data into 29-day periods.
roilims = [1 29; 30 58; 59 87; 88 116];
Extract the regions of interest. Compute the mean temperature of each period and display the values.
sigroi = extractsigroi(tempC,roilims*fs);

cellfun(@mean,sigroi)'
ans = 1×4

   22.8819   22.3073   22.7633   23.0066
Consider a two-column matrix representing possible regions of interest of a 45-sample random signal. Extract the signal samples corresponding to the regions of interest. Concatenate the samples into a single vector.
x = randn(45,1);

roilims = [5 10; 15 25; 30 35];

sigroi = extractsigroi(x,roilims,true);
Plot the signal and highlight the regions of interest.
plot(x)

y = NaN(size(x));

for kj = 1:size(roilims,1)
    roi = roilims(kj,1):roilims(kj,2);
    y(roi) = sigroi(1:length(roi));
    sigroi(1:length(roi)) = [];
end

hold on
plot(y)
hold off

Consider a set of temperature data collected by a thermometer inside an office building for four months. The device takes a reading every half hour. The sample rate is thus 48 measurements/day. Convert the temperature to degrees Celsius.
load officetemp

tempC = (temp-32)*5/9;

fs = 48;
Create region-of-interest (ROI) limits that correspond to five random two-week periods separated by at least 24 hours. Use the temperature readings from these days for an audit.
r = 5;
w = 14*fs;
s = 1*fs;

hq = histcounts(randi(r+1,1,length(tempC)-r*w-(r-1)*s),(1:r+2)-1/2);
t = (1 + (0:r-1)*(w+s) + cumsum(hq(1:r)))';

roilims = [t t+w-1];
Extract the regions of interest. Compute the mean temperature of each audited region of interest and display the values.
sigroi = extractsigroi(tempC,roilims);

cellfun(@mean,sigroi)'
ans = 1×5

   22.8075   22.2586   22.4256   22.9018   23.1457
Extract the regions of interest again, but now concatenate the samples into a single vector. Compute the mean temperature across the audited regions.
sigroic = extractsigroi(tempC,roilims,true);

avgTFc = mean(sigroic)
avgTFc =
22.7078
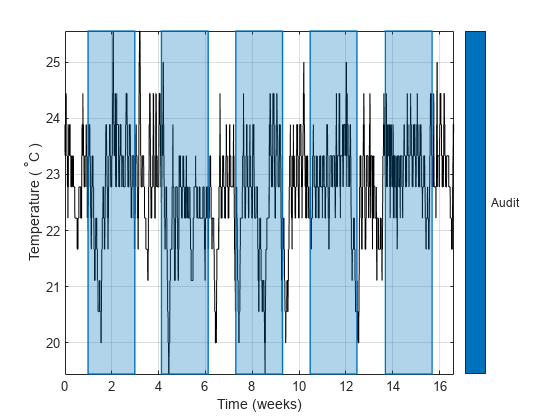
Convert the ROI limits to a binary sequence and create a mask. Express time in weeks.
m = sigroi2binmask(roilims,length(tempC));

msk = signalMask(m,'SampleRate',fs*7,'Categories',"Audit");
Plot the data and visualize the regions of interest with rectangular patches.
plotsigroi(msk,tempC,true)
xlabel('Time (weeks)')
ylabel('Temperature ( {}^\circC )')
Input Arguments
Output Arguments
Extended Capabilities
Version History
Introduced in R2020b