Main Content

fontsize

Figure에 있는 객체의 글꼴 크기 변경

R2022a 이후

    설명

    예제

    fontsize(size,units)는 현재 Figure 내의 모든 텍스트에 대한 글꼴 크기와 글꼴 단위를 설정합니다. Figure에 UI 컴포넌트 또는 범례가 있는 axes 객체와 같은 다른 그래픽스 객체가 포함된 경우 fontsize은 Figure 내에 있는 그러한 객체의 글꼴 크기와 글꼴 단위도 설정합니다. 글꼴 단위는 "points", "pixels", "inches" 또는 "centimeters"일 수 있습니다.

    R2023a 이전: 모든 구문에서 fontsize(obj,size,units)처럼 그래픽스 객체를 첫 번째 입력값으로 지정해야 합니다.

    예제

    fontsize("increase")는 글꼴 크기를 1.1배만큼 늘립니다.

    fontsize("decrease")는 글꼴 크기를 0.9배만큼 줄입니다.

    예제

    fontsize(scale=sfactor)는 글꼴 크기를 sfactor배만큼 스케일링합니다. 예를 들어 120%로 스케일링하려면 스케일링 인자 1.2를 사용합니다.

    예제

    fontsize("default")는 글꼴 크기와 글꼴 단위를 디폴트 자동 값으로 재설정합니다.

    예제

    fontsize(obj,___)는 그래픽스 객체 obj 내의 모든 텍스트에 대한 글꼴 크기를 설정합니다. obj에 다른 그래픽스 객체가 포함된 경우 fontsize는 그러한 객체의 글꼴 크기도 설정합니다. 위에 열거된 모든 구문에서 obj를 첫 번째 입력 인수로 지정할 수 있습니다.

    예제

    모두 축소

    두 개의 선을 포함하고 제목과 범례가 있는 플롯을 만듭니다.

    plot([0 1; 1 2])
    title("Two Very Straight Lines")
    legend("Blue Line","Red Line")

    Figure contains an axes object. The axes object with title Two Very Straight Lines contains 2 objects of type line. These objects represent Blue Line, Red Line.

    글꼴 크기를 16포인트로 늘립니다.

    fontsize(16,"points")
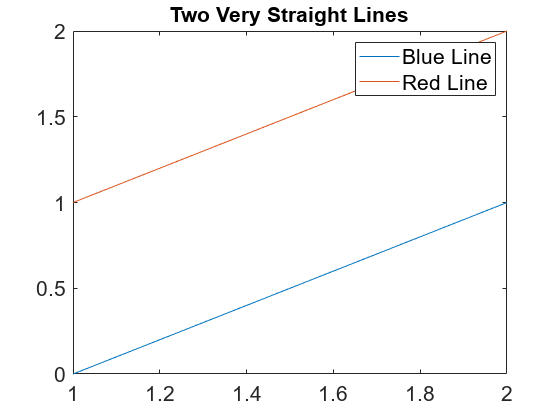
    Figure contains an axes object. The axes object with title Two Very Straight Lines contains 2 objects of type line. These objects represent Blue Line, Red Line.

    R2023a 이전: gcffontsize 함수에 대한 첫 번째 인수로 지정합니다. 예를 들면 fontsize(gcf,16,"points")와 같습니다.

    다양한 글꼴 크기의 여러 텍스트 요소를 가진 플롯을 만듭니다.

    [X,Y,Z] = peaks;
    contourf(X,Y,Z,LineColor="#4F4F4F")
    title("Peak Elevation")
    colorbar
    annotation("textarrow",[.53 .41],[.65 .47],String="Local maxima")
    annotation("textarrow",[.53 .59],[.65 .55])

    Figure contains an axes object. The axes object with title Peak Elevation contains an object of type contour.

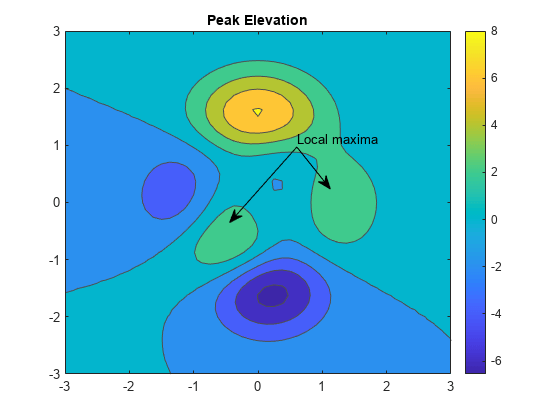
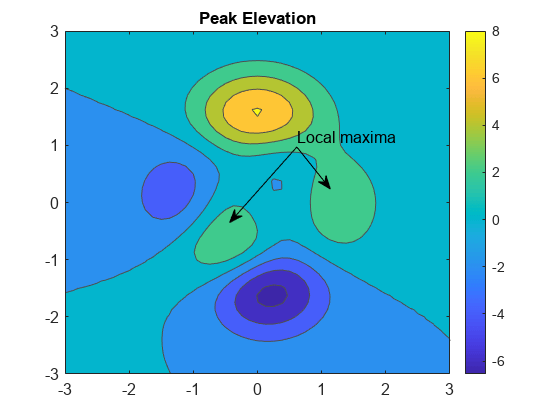
    스케일링 인자 1.2를 사용하여 Figure의 글꼴 크기를 120%로 스케일링합니다. fontsize 함수는 각 글꼴 크기를 개별적으로 스케일링하면서 글꼴의 상대적인 크기는 유지합니다.

    fontsize(gcf,scale=1.2)

    Figure contains an axes object. The axes object with title Peak Elevation contains an object of type contour.

    tiledlayout 함수와 nexttile 함수를 사용하여 여러 플롯을 타일 형식 배열로 만듭니다.

    x = linspace(0,3*pi,200);
    y = cos(x) + rand(1,200);
    t = tiledlayout(2,2);
    
    % Top scatter plot in tiles 1,2
    ax1 = nexttile([1 2]);
    scatter(x,y)
    title("Random Variance on Cosine")
    
    % Lower polar plot in tile 3
    ax2 = nexttile;
    plot(x,cos(x)+0.5)
    
    % Lower histogram in tile 4
    ax3 = nexttile;
    histogram(y,20)

    Figure contains 3 axes objects. Axes object 1 with title Random Variance on Cosine contains an object of type scatter. Axes object 2 contains an object of type line. Axes object 3 contains an object of type histogram.

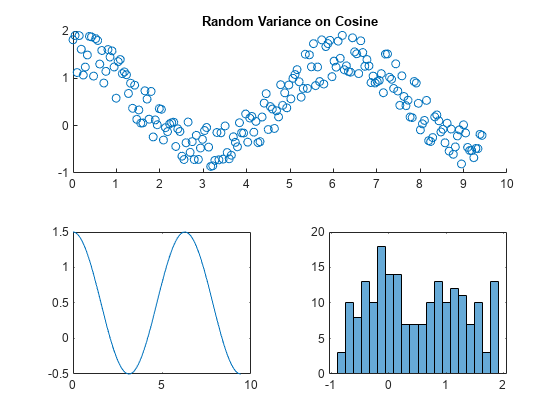
    산점도 플롯의 글꼴 크기를 확대하고 다른 두 플롯의 글꼴 크기를 10픽셀로 변경합니다.

    fontsize(ax1,scale=1.2)
    fontsize([ax2 ax3],10,"pixels")

    Figure contains 3 axes objects. Axes object 1 with title Random Variance on Cosine contains an object of type scatter. Axes object 2 contains an object of type line. Axes object 3 contains an object of type histogram.

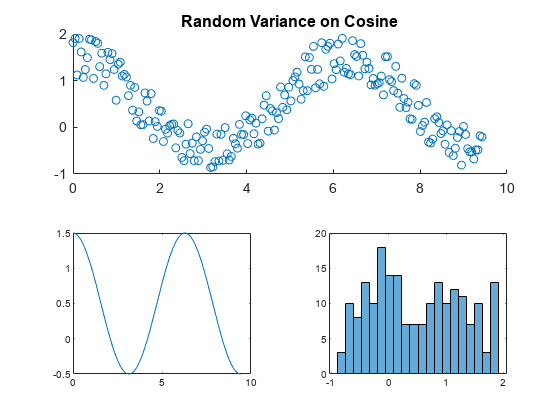
    모든 타일 형식 플롯에서 글꼴 크기 변경을 실행 취소하려면 글꼴 크기와 글꼴 단위를 디폴트 값으로 재설정합니다. gcf에서 반환된 현재 figure 객체를 사용하여 이 변경 사항을 세 개의 플롯에 모두 적용합니다.

    fontsize(gcf,"default")

    Figure contains 3 axes objects. Axes object 1 with title Random Variance on Cosine contains an object of type scatter. Axes object 2 contains an object of type line. Axes object 3 contains an object of type histogram.

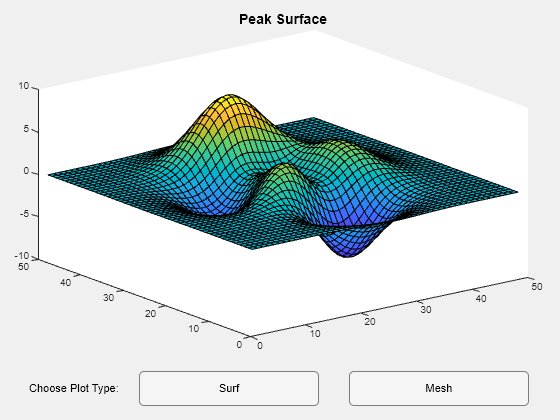
    다음 함수 파일을 생성하여 MATLAB® 경로에 myapplayout.m으로 저장합니다. 이 함수는 다양한 플롯 유형을 사용하여 데이터를 플로팅하는 간단한 앱 레이아웃을 반환합니다.

    function fig = myapplayout
    % Create figure window
    fig = uifigure;
    
    % Create UI components
    ax = uiaxes(fig,Position=[15 70 535 340]);
    lbl = uilabel(fig,Position=[30 15 100 35],Text="Choose Plot Type:");
    b1 = uibutton(fig,Position=[140 15 180 35],Text="Surf");
    b2 = uibutton(fig,Position=[350 15 180 35],Text="Mesh");
    
    % Configure UI component appearance
    surf(ax,peaks);
    fontsize(fig,8,"pixels")
    title(ax,"Peak Surface",FontSize=11)
    end
    

    함수를 호출하고 반환된 figure 객체를 f에 할당합니다.

    f = myapplayout;

    Figure contains an axes object and other objects of type uilabel, uibutton. The axes object with title Peak Surface contains an object of type surface.

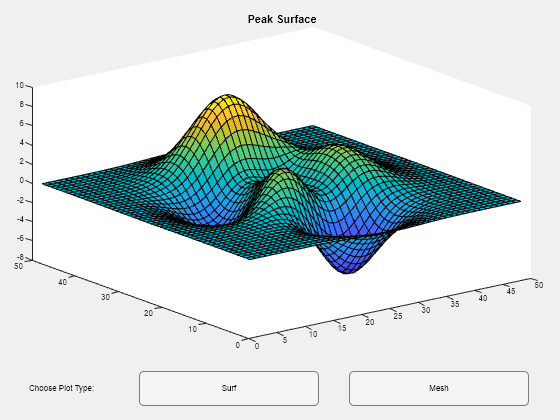
    f를 사용하여 더 쉽게 읽힐 때까지 Figure에 있는 모든 텍스트의 글꼴 크기를 늘립니다. 여기서 fontsize 함수는 각 글꼴 크기를 스케일링 인자 1.1배만큼 개별적으로 늘리면서 글꼴의 상대적인 크기는 유지합니다.

    fontsize(f,"increase")
    fontsize(f,"increase")
    fontsize(f,"increase")

    Figure contains an axes object and other objects of type uilabel, uibutton. The axes object with title Peak Surface contains an object of type surface.

    입력 인수

    모두 축소

    글꼴 크기로, 양의 스칼라 값으로 지정됩니다.

    데이터형: single | double | int8 | int16 | int32 | int64 | uint8 | uint16 | uint32 | uint64

    글꼴 크기 단위로, "points", "pixels", "inches" 또는 "centimeters"로 지정됩니다.

    스케일링 인자로, 스칼라로 지정됩니다. 대상 객체에 속한 모든 글꼴 크기가 sfactor로 스케일링됩니다. 글꼴 크기를 늘리려면 1보다 큰 스케일링 인자를 사용하고 글꼴 크기를 줄이려면 1보다 작은 인자를 사용하십시오.

    예: fontsize(gcf,scale=0.8)은 텍스트를 원래 크기의 80%로 스케일링합니다.

    데이터형: single | double | int8 | int16 | int32 | int64 | uint8 | uint16 | uint32 | uint64

    텍스트를 포함한 객체 또는 컨테이너로, 그래픽스 객체 또는 그래픽스 객체로 구성된 배열로 지정됩니다. fontsize 함수는 지정된 객체의 텍스트 글꼴 크기를 설정합니다. obj에 UI 컴포넌트가 포함된 Figure 또는 범례가 있는 axes 객체와 같은 다른 그래픽스 객체가 포함된 경우 이 함수는 obj 내에 있는 객체의 글꼴 크기와 글꼴 단위도 설정합니다. FontSize 속성이 없는 객체는 영향을 받지 않습니다.

    버전 내역

    R2022a에 개발됨

    모두 확장