condensation
그래프 응축
설명
예제
강한 연결성분을 단일 노드로 응축하기
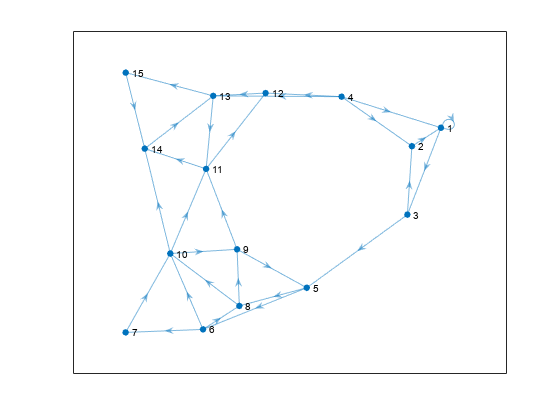
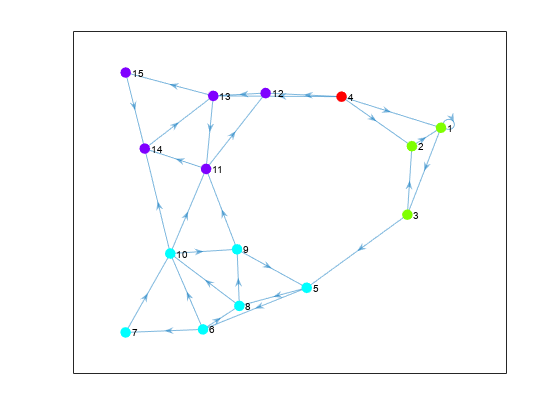
여러 개의 강한 연결성분을 포함하는 그래프를 만들고 플로팅합니다. 강한 연결성분을 강조 표시합니다.
s = [1 1 2 3 3 4 4 4 4 5 5 6 6 6 7 8 8 9 9 10 10 10 11 11 12 13 13 14 15]; t = [1 3 1 2 5 1 2 12 13 6 8 7 8 10 10 9 10 5 11 9 11 14 12 14 13 11 15 13 14]; G = digraph(s,t); p = plot(G);
bins = conncomp(G); p.MarkerSize = 7; p.NodeCData = bins; colormap(hsv(4))
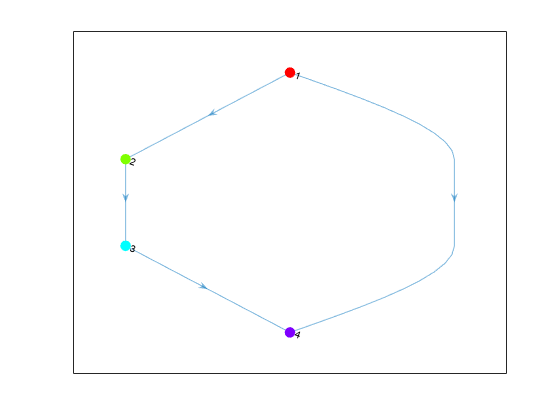
condensation
을 사용하여 각 성분을 단일 노드로 나타냅니다. 해당 노드가 나타내는 성분에 따라 노드 색을 지정합니다.
C = condensation(G); p2 = plot(C); p2.MarkerSize = 7; p2.NodeCData = 1:4; colormap(hsv(4))
입력 인수
출력 인수
버전 내역
R2016b에 개발됨
MATLAB 명령
다음 MATLAB 명령에 해당하는 링크를 클릭했습니다.
명령을 실행하려면 MATLAB 명령 창에 입력하십시오. 웹 브라우저는 MATLAB 명령을 지원하지 않습니다.
Select a Web Site
Choose a web site to get translated content where available and see local events and offers. Based on your location, we recommend that you select: .
You can also select a web site from the following list:
How to Get Best Site Performance
Select the China site (in Chinese or English) for best site performance. Other MathWorks country sites are not optimized for visits from your location.
Americas
- América Latina (Español)
- Canada (English)
- United States (English)
Europe
- Belgium (English)
- Denmark (English)
- Deutschland (Deutsch)
- España (Español)
- Finland (English)
- France (Français)
- Ireland (English)
- Italia (Italiano)
- Luxembourg (English)
- Netherlands (English)
- Norway (English)
- Österreich (Deutsch)
- Portugal (English)
- Sweden (English)
- Switzerland
- United Kingdom (English)