컨벌루션으로 데이터 평활화하기
컨벌루션을 사용하여 고주파수 성분이 포함된 2차원 데이터를 평활화할 수 있습니다.
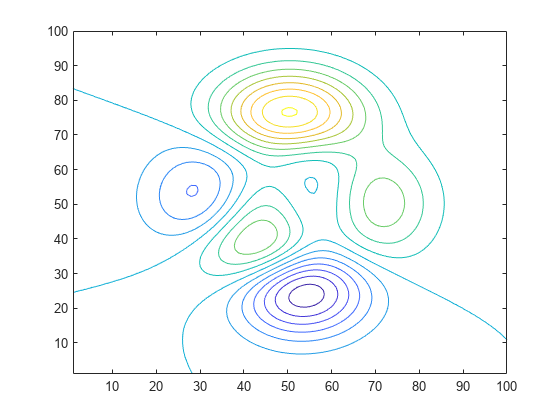
peaks 함수를 사용하여 2차원 데이터를 생성한 후, 다양한 등고선 레벨에 데이터를 플로팅해 보겠습니다.
Z = peaks(100);
levels = -7:1:10;
contour(Z,levels)

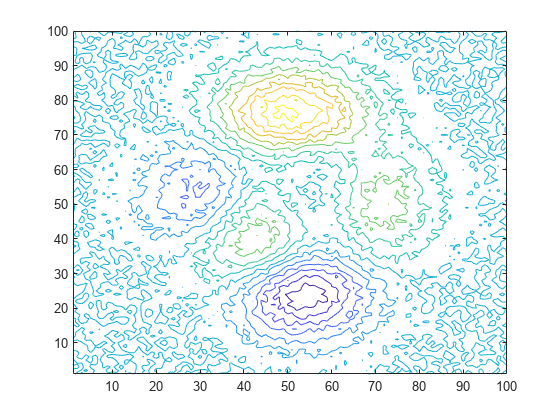
데이터에 랜덤 잡음을 삽입한 후 잡음이 있는 등고선을 플로팅합니다.
Znoise = Z + rand(100) - 0.5;
contour(Znoise,levels)

MATLAB®의 conv2 함수는 지정된 커널을 사용하여 2차원 데이터를 컨벌루션합니다. 여기서 커널의 요소는 원래 데이터의 특징을 제거하거나 향상시키는 방법을 정의합니다. 커널은 입력 데이터와 크기가 같지 않아도 됩니다. 주파수 성분이 몇 개 안 되는 데이터를 평활화하는 데는 작은 크기의 커널로도 충분할 수 있습니다. 더 큰 크기의 커널은 주파수 응답을 미세 조정할 수 있는 더 높은 정밀도를 제공하며, 이를 통해 더 매끄러운 출력을 얻을 수 있습니다.
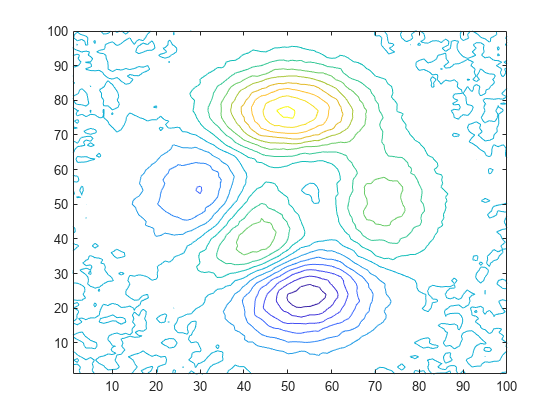
3×3 커널 K를 정의하고 conv2를 사용하여 Znoise의 잡음이 있는 데이터를 평활화해 보겠습니다. 평활화된 등고선을 플로팅합니다. conv2의 'same' 옵션은 출력값의 크기를 입력값과 같게 만듭니다.
K = (1/9)*ones(3);
Zsmooth1 = conv2(Znoise,K,'same');
contour(Zsmooth1, levels)
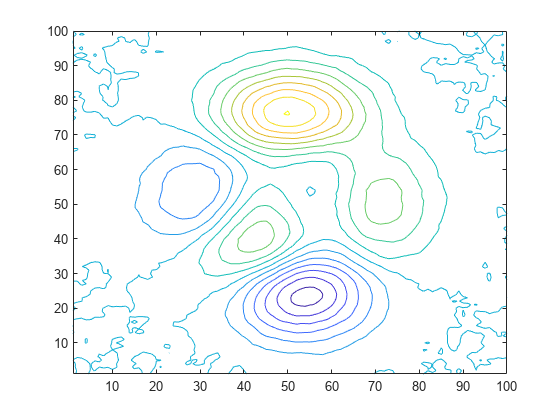
5×5 커널을 사용하여 잡음이 있는 데이터를 평활화한 후, 새 등고선을 플로팅합니다.
K = (1/25)*ones(5);
Zsmooth2 = conv2(Znoise,K,'same');
contour(Zsmooth2,levels)
참고 항목
conv2 | conv | filter | smoothdata