다중 수준 디폴트 값
이 예제에서는 계층 구조에서 둘 이상의 수준에 디폴트 값을 설정합니다. 다음 명령문은 하나의 Figure 창에 두 개의 좌표축을 생성하고 Figure 수준과 좌표축 수준에서 디폴트 값을 설정합니다.
t = 0:pi/20:2*pi;
s = sin(t);
c = cos(t);
figure('defaultAxesPlotBoxAspectRatio',[1 1 1],...
      'defaultAxesPlotBoxAspectRatioMode','manual');
subplot(1,2,1,'defaultLineLineWidth',2);
hold on
plot(t,s,t,c)
text('Position',[3 0.4],'String','Sine')
text('Position',[2 -0.3],'String','Cosine')

subplot(1,2,2,'defaultTextRotation',90);
hold on
plot(t,s,t,c)
text('Position',[3 0.4],'String','Sine')
text('Position',[2 -0.3],'String','Cosine')
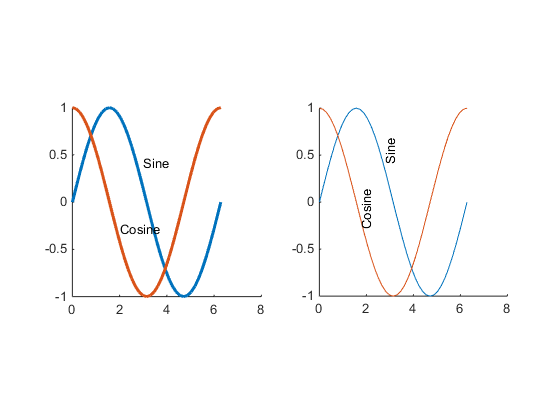
각 서브플롯 영역에 대해 동일한 plot 및 text 명령문을 실행하면 좌표축에 정의된 다른 디폴트 값을 반영하여 다른 결과가 표시됩니다. Figure에 정의되는 디폴트가 두 좌표축 모두에 적용됩니다.
hold on을 호출하여 plot 함수가 axes 속성을 재설정하지 않도록 해야 합니다.
참고
속성에 연결된 모드 속성(예: PlotBoxAspectRatio 및 PlotBoxAspectRatioMode)이 있을 경우, 연결된 속성에 대한 디폴트 값을 정의할 때 manual을 모드 속성에 대한 디폴트 값으로 정의해야 합니다.