Main Content

Combine Line and Stem Plots

This example shows how to combine a line plot and two stem plots. Then, it shows how to add a title, axis labels, and a legend.

Create the data and plot a line.

x = linspace(0,2*pi,60);
a = sin(x);
b = cos(x);
plot(x,a+b)
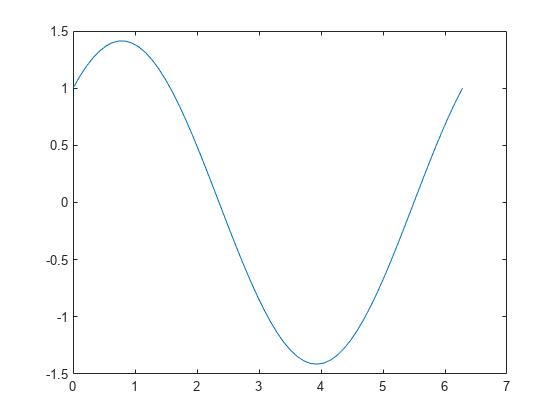
Figure contains an axes object. The axes object contains an object of type line.

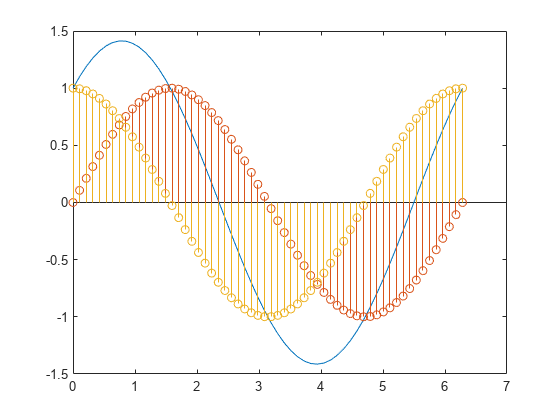
Add two stem plots to the axes. Prevent new plots from replacing existing plots using hold on.

hold on
stem(x,a)
stem(x,b)
hold off

Figure contains an axes object. The axes object contains 3 objects of type line, stem.

Add a title, axis labels, and a legend. Specify the legend descriptions in the order that you create the plots.

title('Linear Combination of Two Functions')
xlabel('Time in \musecs')
ylabel('Magnitude')
legend('a+b','a = sin(x)','b = cos(x)')

Figure contains an axes object. The axes object with title Linear Combination of Two Functions, xlabel Time in mu secs, ylabel Magnitude contains 3 objects of type line, stem. These objects represent a+b, a = sin(x), b = cos(x).

See Also

| |

Go to top of page