makesymbolspec
Create vector layer symbol specification
Description
symbolspec = makesymbolspec(
creates a symbol specification geometry,rule1,rule2,...,ruleN)symbolspec for the shape
geometry according to the rules specified in one or more
rule arguments.
Use symbol specifications to customize the appearance of vector shapes for maps you
create using the mapshow and geoshow functions.
Examples
Import a shapefile containing road data for Concord, MA, as a geospatial table.
roads = readgeotable("concord_roads.shp");Create a symbol specification that specifies the default line color as purple.
blueRoads = makesymbolspec("Line",{'Default','Color','#7E2F8E'});
Display the roads using the symbol specification.
mapshow(roads,"SymbolSpec",blueRoads)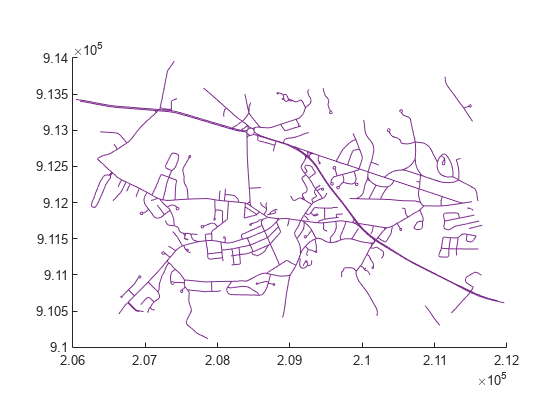
Import a shapefile containing road data for Concord, MA, as a geospatial table.
roads = readgeotable("concord_roads.shp");The CLASS attribute includes information about road types. For example, a value of 2 indicates a multilane highway and a value of 6 indicates a minor road. Create a symbol specification that specifies road colors based on the value of CLASS.
roadColors = makesymbolspec("Line", ...
    {'CLASS',2,'Color','#A2142F'}, ...
    {'CLASS',3,'Color','#77AC30'}, ...
    {'CLASS',6,'Color','#0072BD'}, ...
    {'Default','Color','k'});
Display the roads using the symbol specification.
mapshow(roads,"SymbolSpec",roadColors)
Import a shapefile containing road data for Concord, MA, as a geospatial table.
roads = readgeotable("concord_roads.shp");The CLASS attribute includes information about road types. For example, a value of 2 indicates a multilane highway and a value of 6 indicates a minor road. Create a symbol specification that specifies line styles and widths based on the value of CLASS such that major roads have a thick dashed lines and minor roads have thin dash-dotted lines.
lineStyles = makesymbolspec("Line", ...
    {'CLASS',[1 3],'LineStyle',':','LineWidth',2}, ...
    {'CLASS',[4 6],'LineStyle','-.','LineWidth',0.25});
Display the roads using the symbol specification.
mapshow(roads,"SymbolSpec",lineStyles)
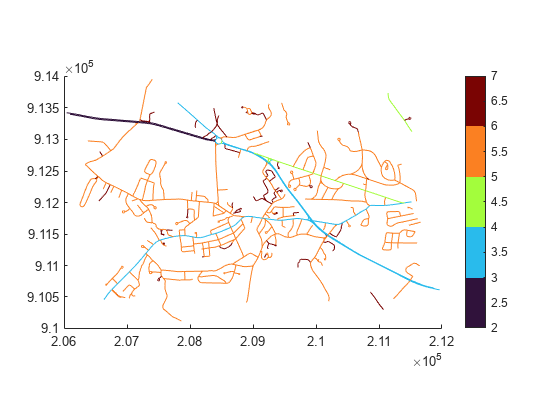
Import a shapefile containing road data for Concord, MA, as a geospatial table.
roads = readgeotable("concord_roads.shp");The CLASS attribute includes information about road types. For example, a value of 2 indicates a multilane highway, a value of 3 indicates a major road, and a value of 6 indicates a minor road. Create a symbol specification that specifies line colors in the turbo colormap based on the value of CLASS so that highways are blue, major roads are green, and minor roads are red.
cmap = turbo(5);
colorRange = makesymbolspec("Line", ...
    {'CLASS',[2 6],'Color',cmap});
Display the roads using the symbol specification.
mapshow(roads,"SymbolSpec",colorRange)Add a colorbar to the map by setting the colormap and colormap limits of the axes.
colormap(cmap)
clim([2 7])
colorbar
Input Arguments
Version History
Introduced before R2006a