Customize Appearance of Map Axes
A map axes object is a type of axes object, similar to axes objects, geographic axes objects, and polar axes objects. This example shows how to customize the map axes by changing the tick label format, the geographic limits, the appearance of the graticule line, and the colors of fonts.
By default, most plotting functions reset many of the axes properties. As a result, this example customizes the properties of the axes after plotting the data. To customize map axes before plotting the data, set the hold state of the axes to on by using the hold function.
Create Map
Import a shapefile of hydrographic data into the workspace as a geospatial table. The table represents the data using polygon shapes in projected coordinates. Extract a row that contains data about a pond.
hydro = readgeotable("concord_hydro_area.shp");
pond = hydro(14,:);
Create a map using the projected coordinate reference system from the data file. Then, plot the pond polygon and add a title.
figure
newmap(pond.Shape.ProjectedCRS)

geoplot(pond)
title("Hydrographic Data")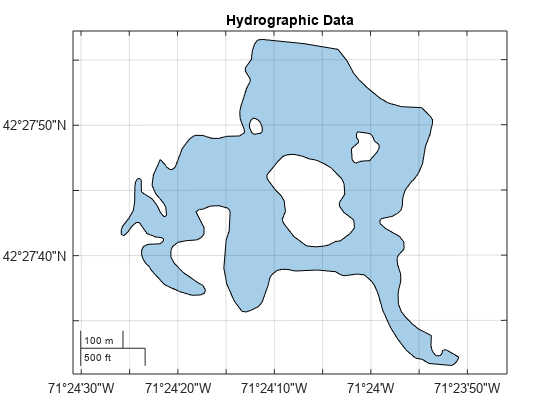
Change Tick Format
Change the format of the tick labels to decimal degrees by using the geotickformat function.
geotickformat dd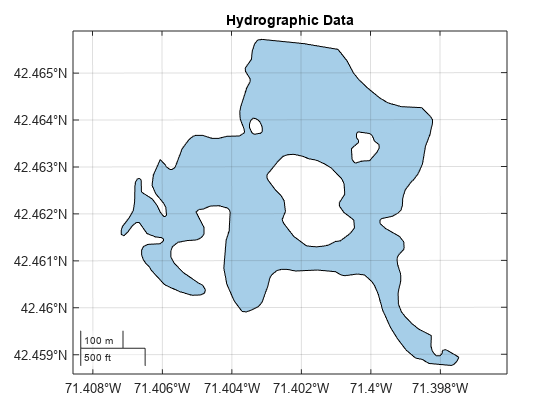
Change Geographic Limits
Change the latitude and longitude limits by using the geolimits function.
geolimits([42.4618 42.4663],[-71.4033 -71.3955])

Change Appearance of Graticule Lines
MapAxes objects have properties that you can use to customize the appearance of the axes. For example, the GraticuleColor, GraticuleLineStyle, GraticuleLineWidth, and GraticuleAlpha properties control the color, line style, line width, and transparency of the graticule lines.
Access the MapAxes object and then change the properties of the graticule lines.
mx = gca;
mx.GraticuleColor = [0.5 0.5 0];
mx.GraticuleLineStyle = "--";
mx.GraticuleLineWidth = 2;
mx.GraticuleAlpha = 0.3;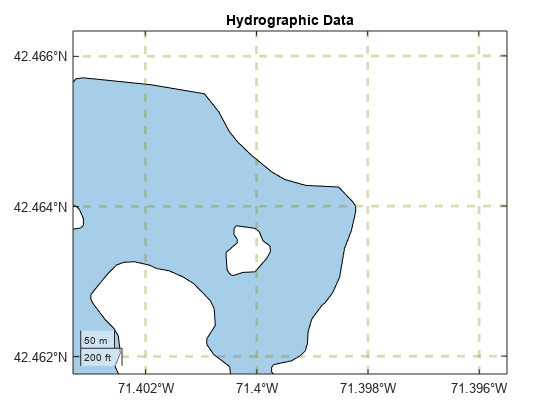
Remove the graticule lines by setting the GraticuleLineStyle property to "none".
mx.GraticuleLineStyle = "none";
Change Font Color
The FontColor property controls the font color for the title, tick labels, and scale bar. Change the font color of the map axes object.
mx.FontColor = [0 0.4470 0.7410];

To change the color of only the title, set the Color property of the title.
mx.Title.Color = "k";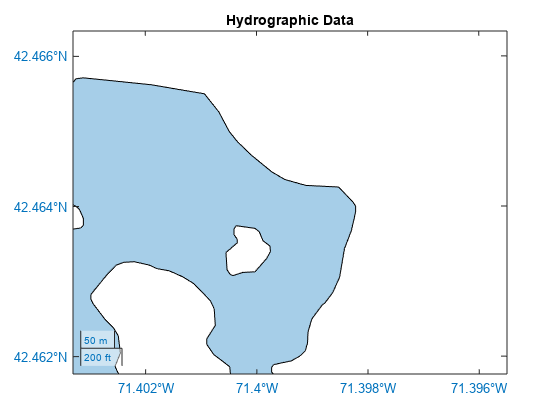
To change the font color for only the scale bar, set the FontColor property of the scale bar.
mx.Scalebar.FontColor = [0.8500 0.3250 0.0980];

See Also
Functions
newmap|geoplot|geolimits|geotickformat