Specify Desired 2-D Frequency Response for Linear Image Filters
This example shows how to specify the desired 2-D frequency response for different types of linear image filters.
The frequency response of a filter is a mathematical function that describes how much a filter amplifies or attenuates input signals of different frequencies. Design a 2-D filter in the frequency domain from a desired frequency response, for image processing, with these steps.
Create a matrix of frequencies by using the
freqspacefunction. Thefreqspacefunction returns the implied frequency range for equally spaced frequency responses for any matrix size. If you create this matrix using frequency points other than those provided byfreqspace, you might encounter unexpected results, such as nonlinear phase behavior.Specify the desired response for the frequencies returned by the
freqspacefunction. Filters with real coefficients are desirable for most image processing applications. To achieve this, in general, the desired frequency response must be symmetric about the frequency origin.Design the filter from the desired frequency response by using the
fsamp2,fwind1, orfwind2function.
Design Low-Pass Filter
Create a matrix of frequencies by using the freqspace function.
[f1,f2] = freqspace(25,"meshgrid");Specify an ideal circular low-pass filter with a cutoff at 0.4 as the desired frequency response.
d = sqrt(f1.^2 + f2.^2) < 0.4;
Hd = zeros(25,25);
Hd(d) = 1;
Visualize the frequency response.
mesh(f1,f2,Hd)
title("Desired Frequency Response — Low-Pass Filter")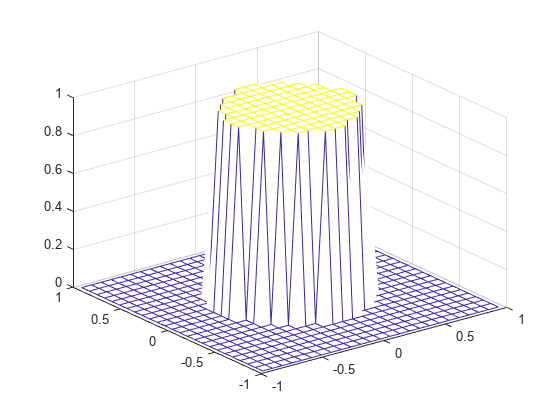
Create the filter based on the desired frequency response by using the fsamp2 function. The fsamp2 function returns the filter h in the spatial domain with a frequency response that passes through the points in the input matrix Hd.
h = fsamp2(Hd);
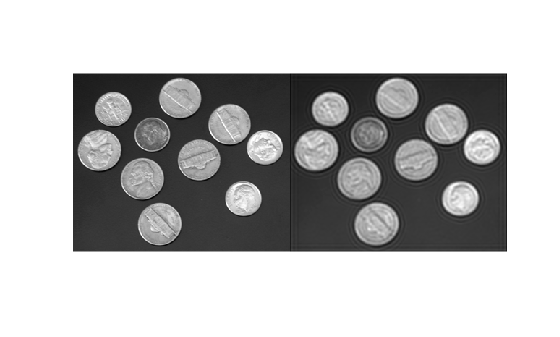
Filter an image using the designed filter, and visualize the results. Observe that a low-pass filter blurs the image.
inputImage = imread("coins.png");
outputImage = imfilter(inputImage,h);
imshowpair(inputImage,outputImage,"montage")
Design High-Pass Filter
Create a matrix of frequencies by using the freqspace function.
[f1,f2] = freqspace(25,"meshgrid");Specify an ideal circular high-pass filter with a cutoff at 0.5 as the desired frequency response.
d = sqrt(f1.^2 + f2.^2) > 0.5;
Hd = zeros(25,25);
Hd(d) = 1;
Visualize the frequency response.
mesh(f1,f2,Hd)
title("Desired Frequency Response — High-Pass Filter")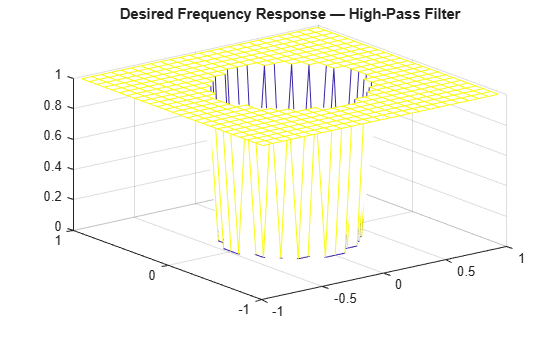
Create the filter based on the desired frequency response by using the fsamp2 function. The fsamp2 function returns the filter h in the spatial domain with a frequency response that passes through the points in the input matrix Hd.
h = fsamp2(Hd);
Filter an image using the designed filter, and visualize the results. Observe that a high-pass filter detects edges in the image.
inputImage = imread("coins.png");
outputImage = imfilter(inputImage,h);
imshowpair(inputImage,outputImage,"montage")

Design Band-Pass Filter
Create a matrix of frequencies by using the freqspace function.
[f1,f2] = freqspace(25,"meshgrid");Specify a high-pass filter frequency response with a cutoff at 0.25 and a low-pass filter frequency response with a cutoff at 0.75.
d1 = sqrt(f1.^2 + f2.^2) > 0.25;
d2 = sqrt(f1.^2 + f2.^2) < 0.75;
Combine the high-pass and low-pass filter with a logical AND operation to specify an ideal circular band-pass filter with cutoffs at 0.25 and 0.75 as the desired frequency response.
d = d1 & d2;
Hd = zeros(25,25);
Hd(d) = 1;
Visualize the frequency response.
mesh(f1,f2,Hd)
title("Desired Frequency Response — Band-Pass Filter")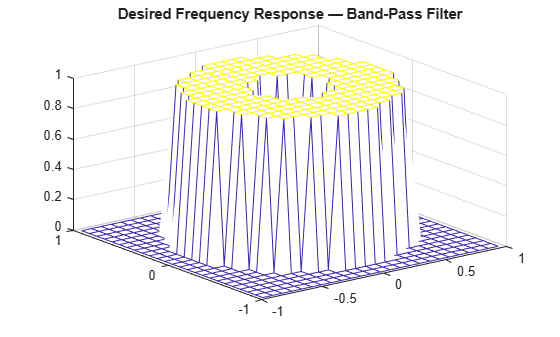
Create the filter based on the desired frequency response by using the fsamp2 function. The fsamp2 function returns the filter h in the spatial domain with a frequency response that passes through the points in the input matrix Hd.
h = fsamp2(Hd);
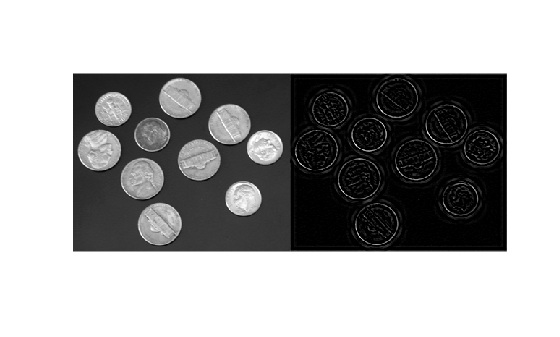
Filter an image using the designed filter, and visualize the results. Observe that the filter detects the edges in the image, but smooths them to give continuous edges.
inputImage = imread("coins.png");
outputImage = imfilter(inputImage,h);
imshowpair(inputImage,outputImage,"montage")
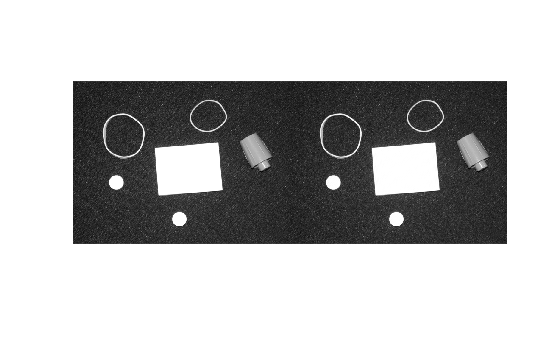
Design Notch Filter
Read a textured image into the workspace, convert it to grayscale, and visualize it. Observe that the background has a fine periodic texture.
inputImage = imread("pillsetc.png");
inputImage = im2gray(inputImage);
figure
imshow(inputImage)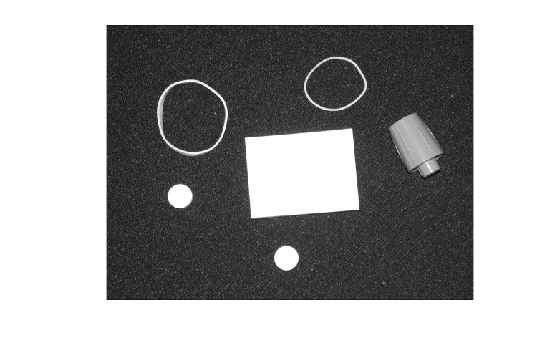
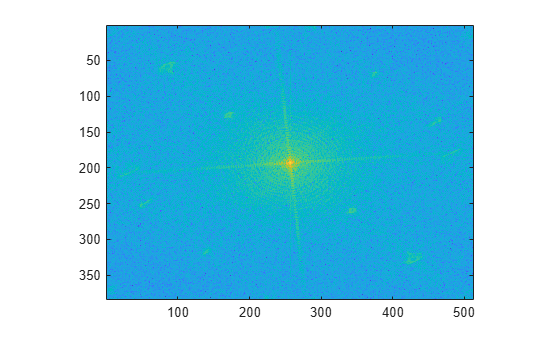
Compute and visualize the frequency representation of the image. Observe that the texture shows up as spikes in the frequency representation.
F = fft2(inputImage);
F = fftshift(F);
logabsF = log(abs(F));
figure
imagesc(logabsF)
axis equal tight
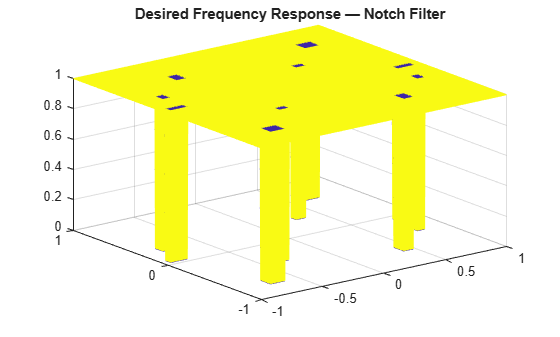
Identify the locations of the spikes in the frequency representation, and design a frequency response to suppress some of the spikes. You do not need to generate a frequency matrix using the freqspace function because you are designing a frequency response from the frequency representation of the image itself.
Hd = ones(size(F));
Hd(50:70,70:100) = 0;
Hd(end-70:end-50,end-100:end-70) = 0;
Hd(120:130,160:180) = 0;
Hd(end-130:end-120,end-180:end-160) = 0;
Hd(245:260,45:60) = 0;
Hd(end-260:end-245,end-60:end-45) = 0;
Hd(300:320,130:150) = 0;
Hd(end-320:end-300,end-150:end-130) = 0;
Hd(200:210,15:50) = 0;
Hd(end-210:end-200,end-50:end-15) = 0;
Visualize the frequency response.
[f1,f2] = freqspace(size(F),"meshgrid");
mesh(f1,f2,Hd)
title("Desired Frequency Response — Notch Filter")
Create the filter based on the desired frequency response by using the fsamp2 function. The fsamp2 function returns the filter h in the spatial domain with a frequency response that passes through the points in the input matrix Hd.
h = fsamp2(Hd);
h = real(h);
Filter the image using the designed filter, and visualize the results. Observe that the filter suppresses the diagonal lines in the textured background.
outputImage = imfilter(inputImage,h);
imshowpair(inputImage,outputImage,"montage")