Sliding Neighborhood Operations
A sliding neighborhood operation is an operation that is performed a pixel at a time, with the value of any given pixel in the output image being determined by the application of an algorithm to the values of the corresponding input pixel's neighborhood. A pixel's neighborhood is some set of pixels, defined by their locations relative to that pixel, which is called the center pixel. The neighborhood is a rectangular block, and as you move from one element to the next in an image matrix, the neighborhood block slides in the same direction. (To operate on an image a block at a time, rather than a pixel at a time, use the distinct block processing function. See Distinct Block Processing for more information.)
The following figure shows the neighborhood blocks for some of the elements in a 6-by-5 matrix with 2-by-3 sliding blocks. The center pixel for each neighborhood is marked with a dot. For information about how the center pixel is determined, see Determine the Center Pixel.
Neighborhood Blocks in a 6-by-5 Matrix

Determine the Center Pixel
The center pixel is the actual pixel in the input image being processed by the operation. If the neighborhood has an odd number of rows and columns, the center pixel is actually in the center of the neighborhood. If one of the dimensions has even length, the center pixel is just to the left of center or just above center. For example, in a 2-by-2 neighborhood, the center pixel is the upper left one.
For any m-by-n neighborhood, the center pixel
is
floor(([m n]+1)/2)
In the 2-by-3 block shown in the preceding figure, the center pixel is (1,2), or the pixel in the second column of the top row of the neighborhood.
General Algorithm of Sliding Neighborhood Operations
To perform a sliding neighborhood operation,
Select a single pixel.
Determine the pixel's neighborhood.
Apply a function to the values of the pixels in the neighborhood. This function must return a scalar.
Find the pixel in the output image whose position corresponds to that of the center pixel in the input image. Set this output pixel to the value returned by the function.
Repeat steps 1 through 4 for each pixel in the input image.
For example, the function might be an averaging operation that sums the values of the neighborhood pixels and then divides the result by the number of pixels in the neighborhood. The result of this calculation is the value of the output pixel.
Border Padding Behavior in Sliding Neighborhood Operations
As the neighborhood block slides over the image, some of the pixels in a neighborhood might be missing, especially if the center pixel is on the border of the image. For example, if the center pixel is the pixel in the upper left corner of the image, the neighborhoods include pixels that are not part of the image.
To process these neighborhoods, sliding neighborhood operations pad the borders of the image, usually with 0's. In other words, these functions process the border pixels by assuming that the image is surrounded by additional rows and columns of 0's. These rows and columns do not become part of the output image and are used only as parts of the neighborhoods of the actual pixels in the image.
Implementing Linear and Nonlinear Filtering as Sliding Neighborhood Operations
You can use sliding neighborhood operations to implement many kinds of filtering
operations. One example of a sliding neighbor operation is convolution, which is used to
implement linear filtering. MATLAB® provides the conv and filter2
functions for performing convolution, and the toolbox provides the
imfilter function. See What Is Image Filtering in the Spatial Domain? for more information about
these functions.
In addition to convolution, there are many other filtering operations you can implement through sliding neighborhoods. Many of these operations are nonlinear in nature. For example, you can implement a sliding neighborhood operation where the value of an output pixel is equal to the standard deviation of the values of the pixels in the input pixel's neighborhood.
To implement a variety of sliding neighborhood operations, use the nlfilter function. nlfilter takes as input arguments
an image, a neighborhood size, and a function that returns a scalar, and returns an
image of the same size as the input image. nlfilter calculates the
value of each pixel in the output image by passing the corresponding input pixel's
neighborhood to the function.
Note
Many operations that nlfilter can implement run much faster if
the computations are performed on matrix columns rather than rectangular
neighborhoods. For information about this approach, see Use Column-wise Processing to Speed Up Sliding Neighborhood or Distinct Block Operations.
For example, this code computes each output pixel by taking the standard deviation of the values of the input pixel's 3-by-3 neighborhood (that is, the pixel itself and its eight contiguous neighbors).
I = imread("tire.tif");
I2 = nlfilter(I,[3 3],"std2");
You can also write code to implement a specific function, and then use this function
with nlfilter. For example, this command processes the matrix
I in 2-by-3 neighborhoods with a function called
myfun.m. The syntax @myfun is an example of a
function handle.
I2 = nlfilter(I,[2 3],@myfun);
If you prefer not to write code to implement a specific function, you can use an
anonymous function instead. This example converts the image to class
double because the square root function is not defined for the
uint8 data type.
I = im2double(imread("tire.tif"));
f = @(x) sqrt(min(x(:)));
I2 = nlfilter(I,[2 2],f);
(For more information on function handles, see Create Function Handle. For more information about anonymous functions, see Anonymous Functions.)
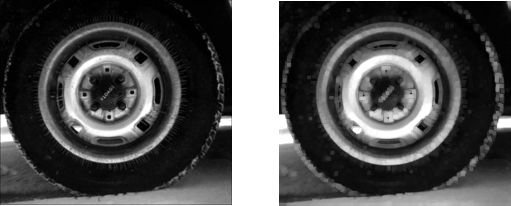
The following example uses nlfilter to set each pixel to the
maximum value in its 3-by-3 neighborhood.
Note
This example is only intended to illustrate the use of
nlfilter. For a faster way to perform this local maximum
operation, use imdilate.
I = imread("tire.tif");
f = @(x) max(x(:));
I2 = nlfilter(I,[3 3],f);
imshow(I);
figure, imshow(I2);
Each Output Pixel Set to Maximum Input Neighborhood Value
