smileMetric
Description
[
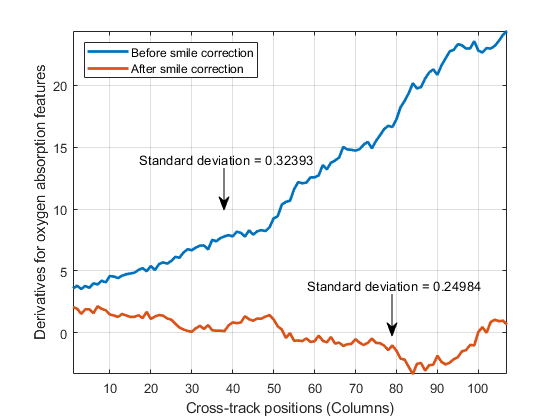
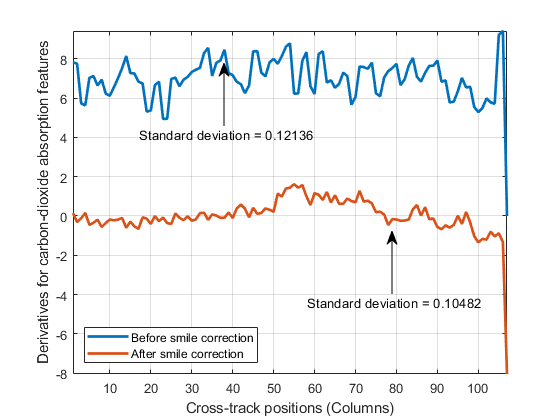
computes the column mean derivatives, and their standard deviations, for the oxygen and
carbon-dioxide absorption features of a hyperspectral data set. You can use these values to
detect the spectral smile effect in the hyperspectral data set. For more information, see
Smile Indicators.oxystd,carbonstd,oxyderiv,carbonderiv] = smileMetric(hcube)
Note
This function requires the Hyperspectral Imaging Library for Image Processing Toolbox™. You can install the Hyperspectral Imaging Library for Image Processing Toolbox from Add-On Explorer. For more information about installing add-ons, see Get and Manage Add-Ons.
The Hyperspectral Imaging Library for Image Processing Toolbox requires desktop MATLAB®, as MATLAB Online™ and MATLAB Mobile™ do not support the library.
Examples
Input Arguments
Output Arguments
More About
References
[1] Dadon, Alon, Eyal Ben-Dor, and Arnon Karnieli. “Use of Derivative Calculations and Minimum Noise Fraction Transform for Detecting and Correcting the Spectral Curvature Effect (Smile) in Hyperion Images.” IEEE Transactions on Geoscience and Remote Sensing 48, no. 6 (June 2010): 2603–12. https://doi.org/10.1109/TGRS.2010.2040391.
Version History
Introduced in R2021a

