measureChromaticAberration
R2026bMeasure chromatic aberration at slanted edges
Syntax
Description
Test Chart Object
aberrationValues = measureChromaticAberration(chart)
aberrationValues = measureChromaticAberration(chart,Name=Value)
Test Chart Image
aberrationValues = measureChromaticAberration(im,roiPositions)roiPositions for test chart image
im.
Examples
Read an image of an eSFR chart into the workspace.
I = imread("eSFRTestImage.jpg");Create an esfrChart object, then display the chart with ROI annotations. The 60 slanted edge ROIs are labeled with green numbers.
chart = esfrChart(I);
displayChart(chart,displayColorROIs=false,...
    displayGrayROIs=false,displayRegistrationPoints=false)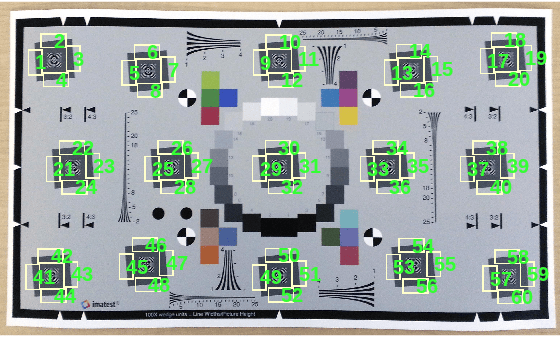
Measure the chromatic aberration in all slanted edge ROIs. Examine the contents of the returned table, chTable, for a single ROI.
chTable = measureChromaticAberration(chart);
ROIIndex = 3;
chTable(3,:)
ans = 1×5 table
    ROI    aberration    percentAberration     edgeProfile     normalizedEdgeProfile
    ___    __________    _________________    _____________    _____________________

     3       1.7983           0.13956         {332×4 table}        {332×4 table}
Store the normalized edge profile in a separate variable, edgeProfile, for clarity. Examine the normalized color intensity of the first and last pixel of edgeProfile.
edgeProfile = chTable.normalizedEdgeProfile{ROIIndex};
edgeProfile([1 end],:)
ans = 2×4 table
normalizedEdgeProfile_R normalizedEdgeProfile_G normalizedEdgeProfile_B normalizedEdgeProfile_Y
_______________________ _______________________ _______________________ _______________________
0.003784 0.0026729 0.011565 0.0041317
0.98932 0.98978 1.0076 0.99009
Plot the normalized intensity for the ROI.
npix = length(edgeProfile.normalizedEdgeProfile_R);
plot(1:npix,edgeProfile.normalizedEdgeProfile_R,"r", ...
    1:npix,edgeProfile.normalizedEdgeProfile_G,"g", ...
    1:npix,edgeProfile.normalizedEdgeProfile_B,"b")
xlabel("Pixel")
ylabel("Normalized Intensity")
title("ROI "+ROIIndex+" with Aberration "+chTable.aberration(ROIIndex))
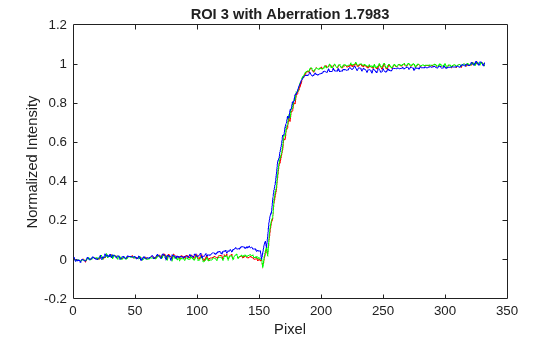
The blue channel has a higher intensity than the red and green channels immediately before the edge, and a lower intensity than the red and green channels immediately after the edge. This difference in intensity contributes to the measured value of chromatic aberration.
The measured values of aberration and percentAberration for this edge are relatively small. Visual inspection of the image confirms that the sides of the edge do not have a strong color tint.
Read and display an image of a custom test chart with slanted edge ROIs.
I = imread("slantedSquare.jpg");
imshow(I)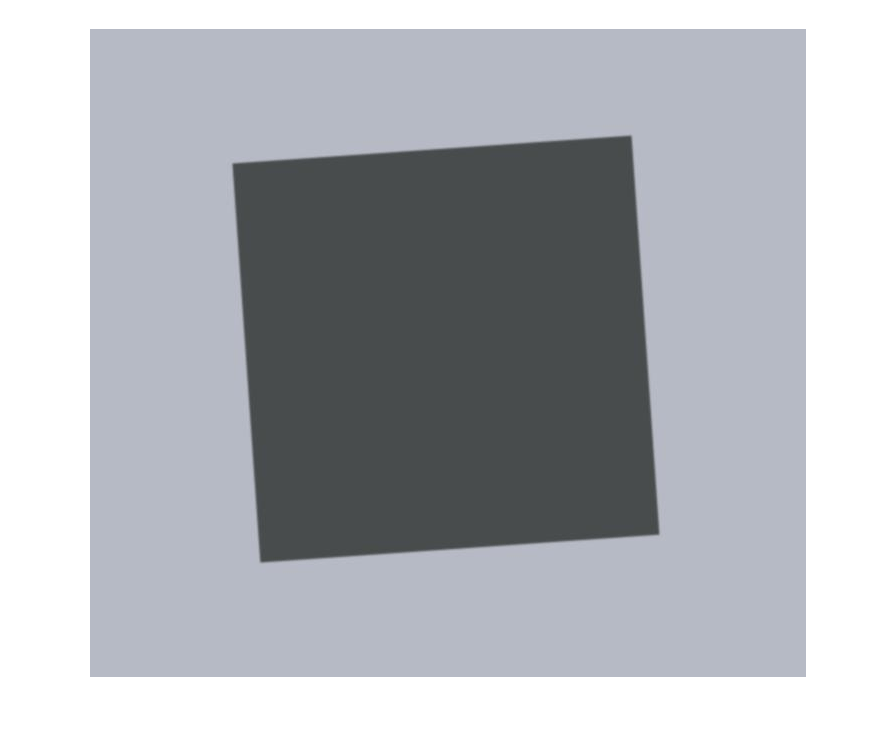
Draw ROIs for the edges, starting at the top and moving clockwise.
numROIs = 4;
roiPos = zeros(numROIs,4);
for cnt = 1:numROIs
    hrect = drawrectangle;
    roiPos(cnt,:) = hrect.Position;
end
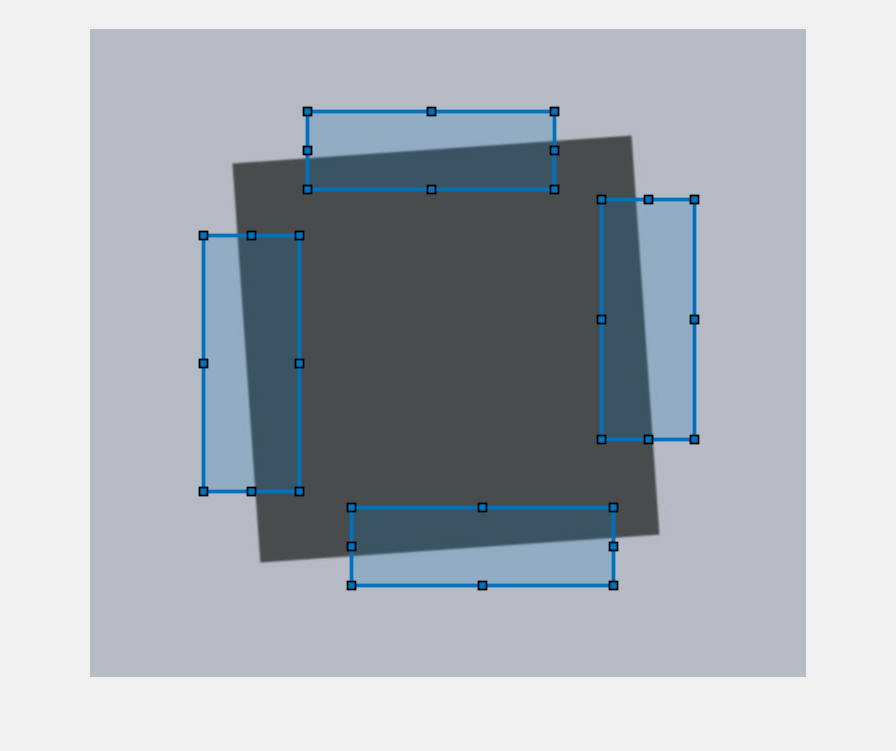
Calculate the chromatic aberration for the selected ROIs.
aberrationValues = measureChromaticAberration(I,roiPos)
aberrationValues = 4×6 table
    1    0.1628    0.0805    316×4 table    316×4 table    218     83    247     78
    2    0.3099    0.1522    376×4 table    376×4 table    512    171     93    240
    3    0.1630    0.0824    316×4 table    316×4 table    262    479    262     78
    4    0.1935    0.0988    388×4 table    388×4 table    114    207     96    256
Plot the normalized intensity of the red, green, and blue color channels for one of the ROIs.
ROIIndex = 3;
edgeProfile = aberrationValues.normalizedEdgeProfile{ROIIndex};
p = plot(edgeProfile, ...
    ["normalizedEdgeProfile_R" "normalizedEdgeProfile_G" "normalizedEdgeProfile_B"]);
p(1).Color = "r";
p(2).Color = "g";
p(3).Color = "b";
xlabel("Pixel")
ylabel("Normalized Intensity")
title("ROI "+ROIIndex+" with Aberration "+aberrationValues.aberration(ROIIndex))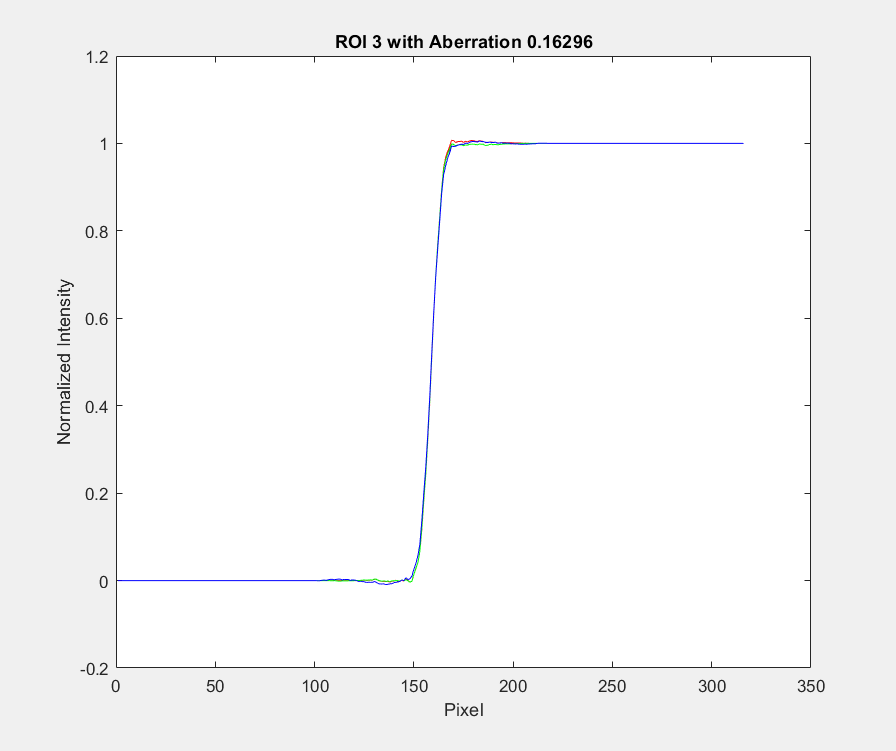
Input Arguments
Name-Value Arguments
Output Arguments
More About
Tips
Chromatic aberration is best measured at slanted edges that are:
Roughly orthogonal to the line connecting the center of the image and the center of the ROI
Farthest from the center of the image
Because chromatic aberration increases radially from the center of the image, you can ignore measurements at slanted edges near the center of the image.
The absolute chromatic aberration reported in the
aberrationvariable is measured in the horizontal or vertical direction. However, chromatic aberration is a radial phenomenon, and radial measurements are more accurate.
References
[1] Imatest. "Esfr". https://www.imatest.com/mathworks/esfr/.

